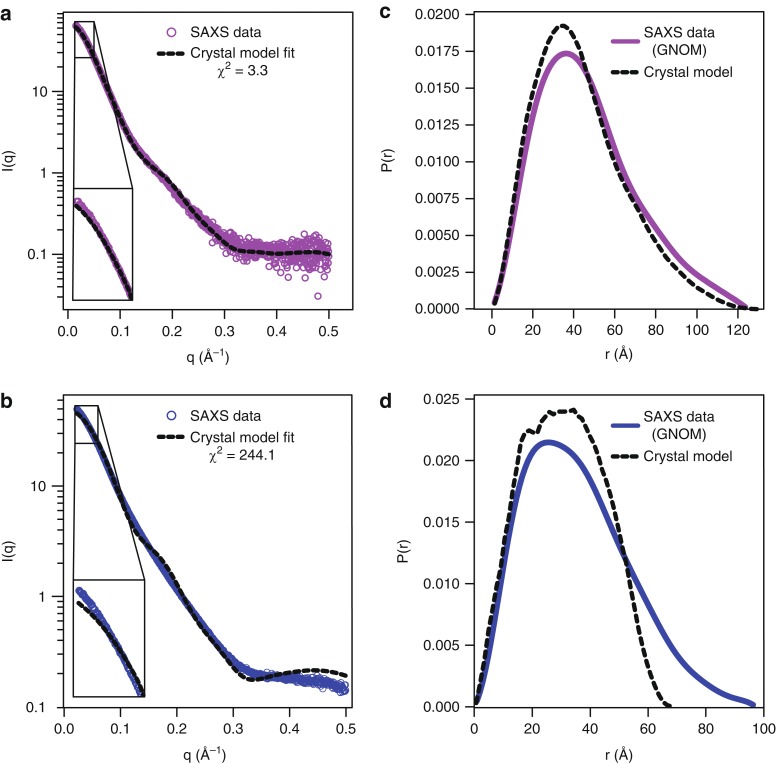
Fig. 2.
Solution phase analysis of the dV–HAVx complex and standalone dV with SAXS. a Fitting of experimental SAXS profile (scattering vector, q = 4π sin θ/λ) obtained by merging the datasets from 1 mg/ml, 2 mg/ml and 4 mg/ml concentrations for the dV–HAVx complex and b for the standalone dV against the scattering profile calculated from the corresponding crystal structure models. Details of SAXS analysis for both standalone dV and dV–HAVx complex are provided in Supplementary Figs. 7 and 8, and Supplementary Table 1. c Pairwise distance distribution calculated from the experimental dataset and the corresponding crystal models for the dV–HAVx complex and d for the standalone dV

