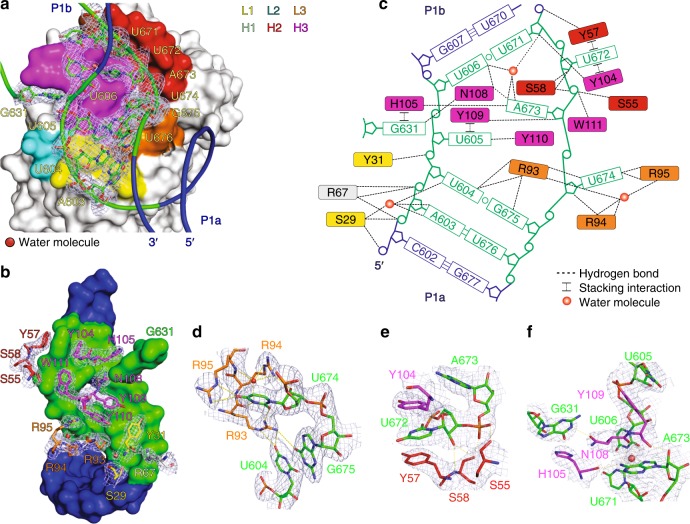
Fig. 3.
Structural features of the dV–Fab binding interface. a Molecular surface of the Fab HAVx and a cartoon of the RNA (L1 bulge) showing the Fab CDRs (L1, L2, L3, H1, H2, and H3) and interacting nucleotides of the RNA epitope including G631. b Molecular surface of the RNA interface (L1 bulge and G631) and the Fab residues that are involved in binding interactions with the RNA epitope. c Schematic summary of Fab–RNA interactions. R67 (gray) represents a scaffold residue from the light chain’s constant domain. d–f Interactions between the RNA epitope and the Fab CDR residues. Epitope nucleotides and Fab CDR residues are colored analogously in all figures. Orange spheres represent water molecules that mediate hydrogen bonds (dashed lines in c–f reflect heteroatoms within hydrogen bonding distance (2.5–3.5 Å). Blue mesh in a, b and d–f represents the 2|Fo|−|Fc| electron density map at 1σ contour level and carve radius 1.8 Å

