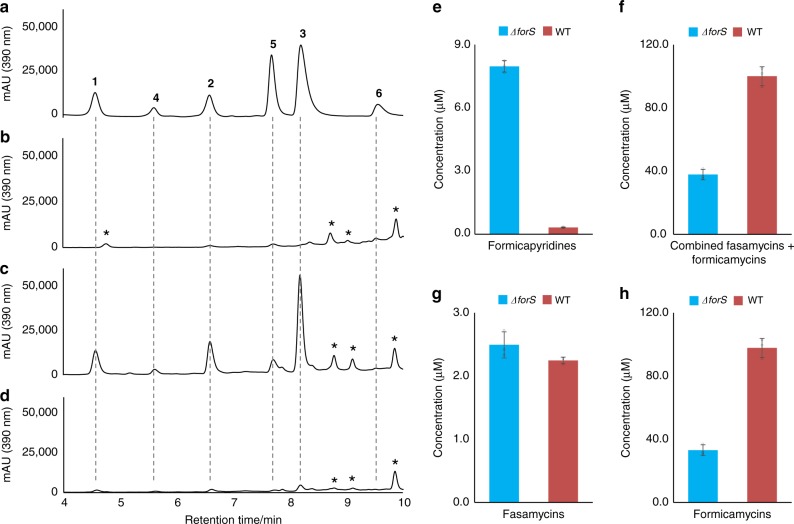
Fig. 6.
Mutational analysis of forS. Reconstituted HPLC chromatograms (UV; 390 nm) showing: a formicapyridine standards 1–6; b S. formicae WT extract; c S. formicae ∆forS extract; d S. formicae ∆forS/forS extract. Quantitative data for the combined titre of each metabolite family produced by the S. formicae WT and ∆forS mutants are shown for: e total formicapyridines; f combined total fasamycins and formicamycins; g total fasamycins; h total formicamycins; (mean ± standard deviation; n = 3 (biological replicates)). The molecular species giving rise to peaks labelled with an asterisk are unrelated to the for pathway based on UV and m/z analysis. The source data underlying Fig. 6e–h are provided as a Source Data file

