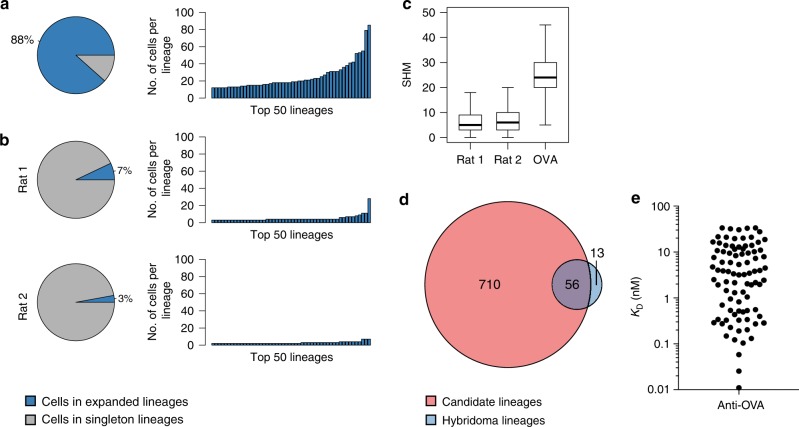
Fig. 6.
Discovery and validation of antigen-reactive antibodies. a Lineage expansions among OVA antigen-reactive B cells. Pie charts indicate percentage of cells belonging to expanded lineages. Bar charts indicate the number of cells for the top 50 lineages. b Lineage expansions observed in B-cell repertoires for two nonimmunized rats, otherwise as in a. c Somatic hypermutations (SHM) for heavy- and light-chain variable germline gene segments for B-cell repertoires from nonimmunized Rat 1 (n = 15,338) and Rat 2 (n = 15,042) and OVA antigen-reactive B cells pooled from three immunized rats (n = 3091). Boxes indicate the interquartile range (IQR), center lines the median, whiskers extend to the most extreme data point within 1.5 × IQR from the box. d Overlap in lineages identified from direct sequencing of individual antigen-reactive B cells by scBCR-seq (red) and concomitant hybridoma experiment (blue). e Validation of candidate OVA antigen-reactive clones. Shown are monovalent affinities of expressed antibodies to OVA

