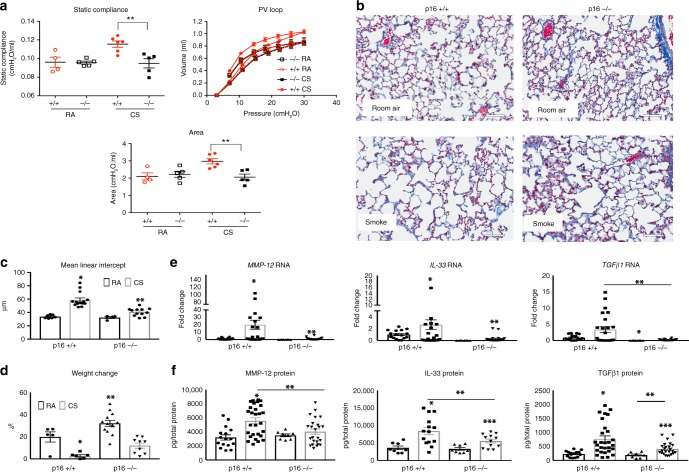
Fig. 3.
p16−/− lungs maintain function and structure when challenged with CS. a Lung compliance (**p < 0.0177), pressure/volume, and area (**p < 0.0001) between the inflation and deflation limb of the PV loop measured using Flexi-Vent. b Representative Masson’s trichrome staining of lungs exposed to RA or CS (scale bar = 40 µm), mean linear intercept was determined c from these images and quantified (*p < 0.0001 and **p < 0.0001 vs. p16−/− RA). d Body weight increases over 4 months, values are the percentage increase from day 0 (*p = 0.0031, **p < 0.0001). Quantitative RT-PCR analysis e of MMP-12 (*p = 0.029 vs. p16+/+ RA, **p = 0.0077 vs. p16+/+ CS), IL-33 (*p = 0.012 vs. p16+/+ RA, **p = 0.045 vs. p16+/+ CS), and TGFβ1 (*p = 0.0021 vs. p16+/+ RA, **p = 0.0036). After 4 months of CS, all samples were normalized to mouse GAPDH. f MMP-12 (*p = 0.0004 vs. p16+/+ RA, **p = 0.0088 vs. p16+/+ CS), IL-33 (*p = 0.004 vs. p16+/+ RA, **p = 0.023 vs. p16+/+ CS, ***p = 0.0452 vs. p16−/− RA), and TGFβ1 (*p = 0.0005 vs. p16+/+ RA, **p = 0.0097, ***p = 0.0036 vs. p16+/+ RA), protein levels determined by ELISA. All protein levels are normalized to total protein in the lysate. All data is expressed as mean ± SEM, n = 4–14 mice per group

