Fig. 6.
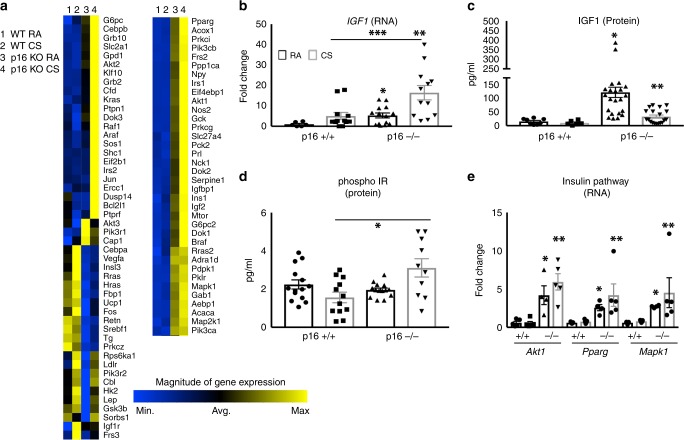
Increased IGF1 signaling in p16−/− lungs. a Heat map of 84 insulin-related genes in lungs treated with CS. Genes in blue are reduced, while genes in yellow are increased. N = 5 lungs per group. b IGF RNA levels measured by TAQman qPCR. *p = 0.016, **p = 0.007, ***p = 0.008. c IGF1 measured by ELISA from whole lung lysates. *p = 0.0028, **p = 0.0421 vs. + /+ CS. d Phospho-insulin receptor measured by ELISA (*p = 0.0085). e Levels of key proliferation signaling genes Akt1 (*p = 0.0137, **p = 0.0011), Pparγ (*p = 0.0009, **p = 0.0392), and MapK1 (*p < 0.0001, **p = 0.039) from profiler array. N = 5 lungs per group

