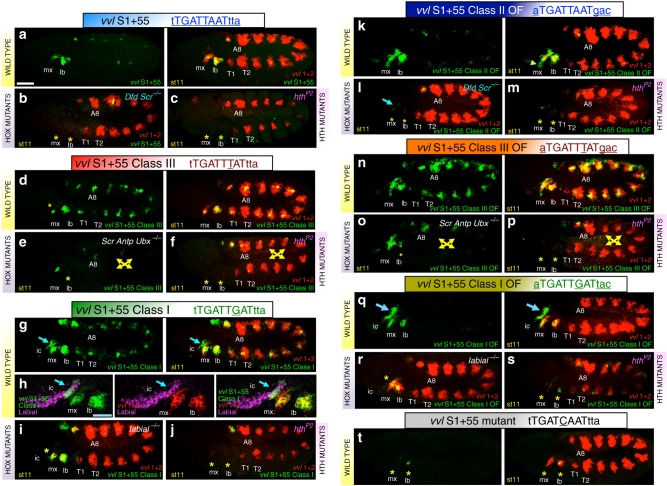
Fig. 2.
Expression of S1+55 variants and vvl1+2 in wild type and mutant backgrounds. Expression of S1+55 class 2 reporter (a, left panel) compared to that of vvl1+2 (a, right panel) in wild type, Dfd Scr (b) or hthP2 (c) mutant embryos. Asterisks mark the segments where S1+55 expression is lost. Expression of S1+55cl3 class 3 containing reporter (d, left panel) compared to that of vvl1+2 in wild type (d, right panel), and its expression in Scr Antp Ubx (e) or hthP2 (f) mutant embryos. Yellow arrows mark the segments where S1+55cl3 expression is lost. Note the maxillary expression in e is in the Dfd domain, which should not be affected in this genotype. Expression of S1+55cl1 class 1 reporter (g, left panel) compared to that of vvl1+2 in wild type (g, right panel). Blue arrow marks the additional intercalary (ic) segment patch where vvl1+2 is not expressed. h Close-up of S1+55cl1 expression (green) in the intercalary segment stained with anti-Lab antibody (purple) compared to vvl1+2 (red) expression. Intercalary S1+55cl1 expression is lost in lab mutant (i) or hthP2 (j) mutant embryos. k Expression of S1+55cl2OF class 2 optimal flanks reporter compared to that of vvl1+2 in wild type (k, right panel); Dfd Scr (l) or hthP2 (m) mutant embryos. Arrowhead in (k, right panel) points to expression outside the normal vvl1+2 domain. Asterisks in l–m mark the segments where S1+55cl2OF expression is lost. n Expression of S1+55cl3OF reporter compared to that of vvl1+2 in wild type (n, right panel); Scr Antp Ubx (o) or hthP2 (p) mutant embryos. Yellow arrows mark the segments where S1+55cl3OF expression is lost. q Expression of S1+55cl1OF reporter compared to that of vvl1+2 in wild type (q, right panel). Blue arrow marks the intercalary segment not expressing vvl1+2 and exhibiting extended Lab expression. Intercalary S1+55cl1OF expression is lost in lab (r) or hthP2 (s) mutant embryos. Expression of S1+55mut (t), a Hox-cofactor mutant site reporter, compared to that of vvl1+2 in wild type embryos (t, right panel). White scale bar 50 μm. Blue scale bar 25 μm. All embryos shown in these and following figures are at stage 11 (st11)

