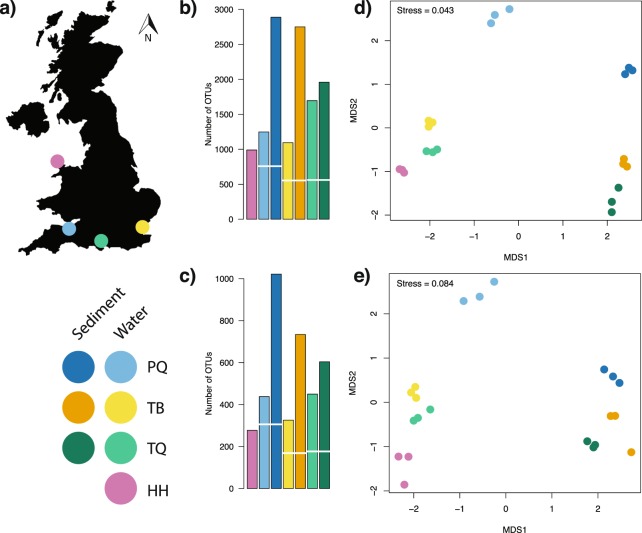
Figure 1.
(a) Map of the United Kingdom indicating the geographic position of the sampled sites, a legend indicates the four sites (PQ, TB, TQ and HH) and colours for water and sediment eDNA samples for each site. Barplots detailing number of OTUs (operational taxonomic units) detected across sampling sites and eDNA sample type for (b) COI and (c) 18S rRNA metabarcoding of UK marinas, the break in bars indicates the number of shared OTUs between sediment and water eDNA samples. Non-metric multidimensional scaling ordination plots based on Bray-Curtis dissimilarities of: (d) COI and (e) 18S rRNA metabarcoding of marina sediment and water eDNA samples.

