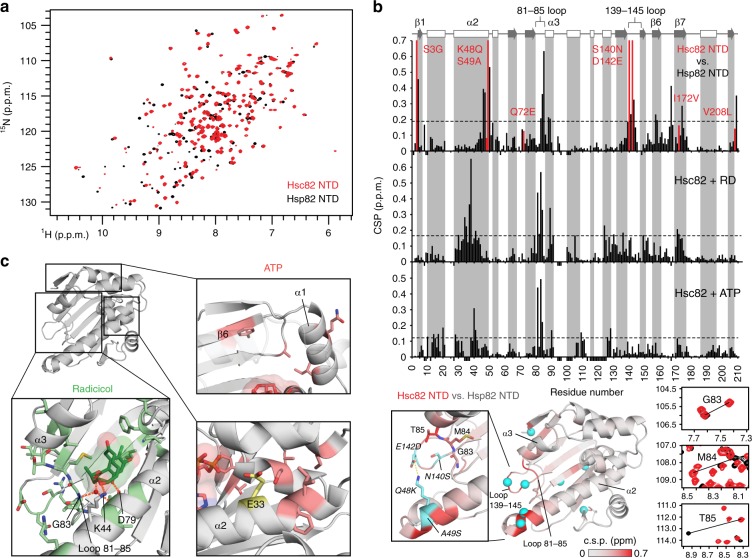
Fig. 5.
Comparison of the NTDs of yeast Hsp90 isoforms by NMR. a Overlay of 1H-15N HSQC spectra of Hsc82 (red) and Hsp82 (black). b Chemical shift perturbation (CSP) of apo-Hsc82 vs. apo-Hsp82 (top), Hsc82+RD (middle), and Hsc82+ATP (bottom). Red bars indicate residues that differ between the two isoforms, negative bars represent residues that are missing. Secondary structure elements derived from NMR secondary chemical shifts using TALOS+ are shown on top (arrow: β-strand: rectangles: α-helix). The CSP comparing isoforms are mapped onto the crystal structure of Hsp82 NTD (PDB id 1AH627, bottom), with isoform-specific residues shown as cyan spheres. Inset shows a close-up view of the C-end of helix α2 and surrounding loops (bold), together with the salt bridge between Lys48 and Asp142 (italic). Panels at the right are zoomed views of the spectra in a showing peak shifts from residues of the 81–85 loop. c Mapping of differential CSPs of the two isoforms upon binding of RD (green sticks) and ATP (red sticks). For RD, regions with higher deviations correspond to loop 81–85, helixes α2, and α3 (bold), while for ATP to strand β6 and helix α1, together with residues surrounding the catalytic residue Glu33

