Fig. 1.
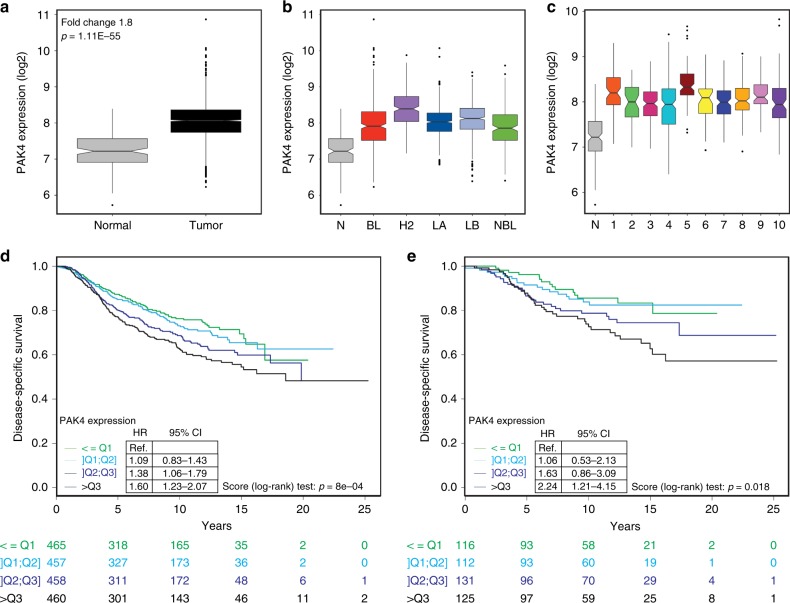
PAK4 overexpression in breast cancer is associated with unfavorable outcome. a PAK4 mRNA expression in breast carcinomas (n = 1992) and normal breast tissues (n = 144) in the METABRIC breast cancer cohort. b PAK4 expression across the five distinct molecular subtypes of breast cancer based on the PAM50 signature in the METABRIC breast cancer cohort (BL: Basal-like n = 331; H2: HER2-enriched n = 240; LA: Luminal A n = 721; LB: Luminal B n = 492; NBL: Normal Breast-like n = 202). c PAK4 expression among the ten distinct integrative clusters (IC) of breast cancer using the IC10 classification in the METABRIC breast cancer cohort (IC1 n = 76; IC2 n = 45; IC3 n = 156; IC4 n = 167; IC5 n = 94; IC6 n = 44; IC7 n = 109; IC8 n = 143; IC9 n = 67; IC10 n = 96). d Kaplan–Meier plot and analysis of disease-specific survival (DSS) in the METABRIC breast cancer cohort stratified according to quartiles of PAK4 expression. e Kaplan–Meier plot and analysis of DSS in the METABRIC cohort without systemic adjuvant treatment stratified according to quartiles of PAK4 expression. In a–c data are represented as boxplots where the middle line is the median, the lower and upper hinges correspond to the first and third quartiles, the upper whisker extends from the hinge to the largest value no further than 1.5 × IQR from the hinge (where IQR is the inter-quartile range) and the lower whisker extends from the hinge to the smallest value at most 1.5 × IQR of the hinge, while data beyond the end of the whiskers are outlying points that are plotted individually. The Fold Change and the p-value of a Mann–Whitney test are indicated in a. PAK4 expression in normal breast tissues (N) as seen in a is displayed to facilitate comparisons in b and c. The Hazard Ratios (HR), 95% confidence intervals (CI) and p-values by the log-rank (Mantel–Cox) test are indicated in d and e. n is specified for each patient subgroup below d and e

