Fig. 2.
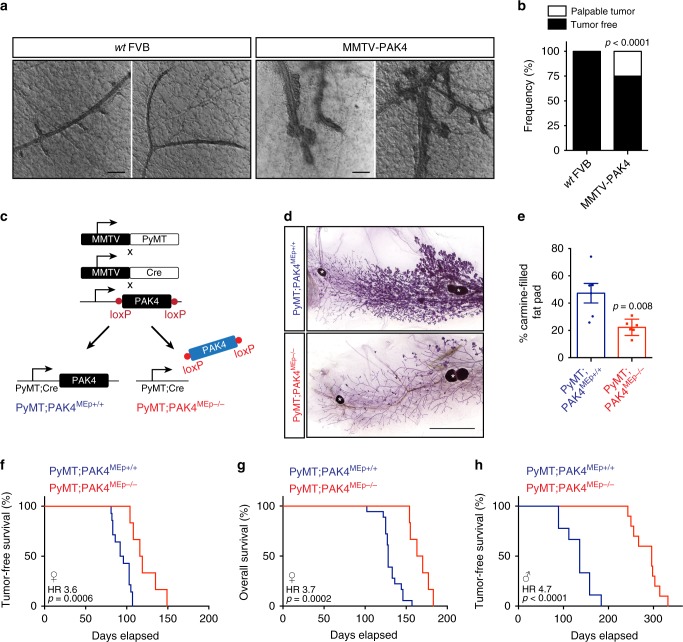
PAK4 promotes murine mammary tumorigenesis. a Representative images of mammary epithelium from 6-month-old females of the indicated genotypes. Scale bars, 200 μm. b Tumor incidence in aged virgin mice (20–24 months old) of the indicated genotypes (n = 16 wt FVB and n = 20 MMTV–PAK4). c Schematic diagram of the MMTV–PyMT mouse strains used. d Representative images of carmine-stained wholemounts of inguinal mammary glands from 12 weeks old female mice of the indicated genotypes. Scale bar, 5 mm. White asterisks denote lymph nodes. e Quantification of carmine-filled fat pad area (n = 6 per indicated genotype). f Kaplan–Meier plot of tumor-free survival in female mice of the indicated genotypes (n = 14 PyMT;PAK4MEp+/+ and n = 6 PyMT;PAK4MEp−/−). g Kaplan–Meier plot of overall survival in female mice of the indicated genotypes (n = 18 PyMT;PAK4MEp+/+ and n = 6 PyMT;PAK4MEp−/−). h Kaplan–Meier plot of tumor-free survival in male mice of the indicated genotypes (n = 9 PyMT;PAK4MEp+/+ and n = 10 PyMT;PAK4MEp−/−). Data are represented as percentage in b and as mean ± SEM in e. The p-values by chi-square test in b and by two-tailed unpaired t test in e are indicated. Dots in e depict individual samples. The Hazard Ratios (HR) and p-values by log-rank (Mantel–Cox) test are indicated in f–h

