Fig. 4.
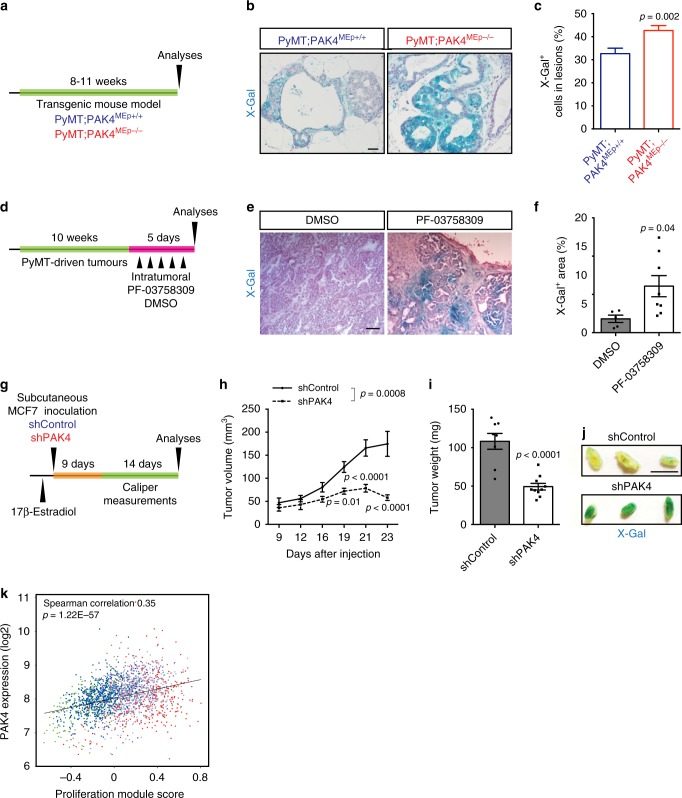
PAK4 inhibition induces senescence-like programs in vivo. a Schematic diagram of the experimental set up using the transgenic mouse model. b Representative X-Gal-stained PyMT-driven early mammary lesions from each indicated genotype. Scale bar, 100 μm. c Quantification of the percentage of X-Gal+ cells per lesion (PyMT;PAK4MEp+/+ n = 90 and PyMT;PAK4MEp−/− n = 75, entailing 15 lesions per animal derived from 5 to 6 animals per group). d Schematic diagram of the experimental set up using the PAK4 inhibitor PF-03758309. e Representative images of X-Gal-stained sections of PyMT tumors that were treated with the PAK4 inhibitor (PF-03758309) or DMSO. Scale bar, 250 μm. f Quantification of X-Gal+ areas in tumor sections of PyMT-treated tumors (DMSO n = 5 and PF-03758309 n = 8). g Schematic diagram of the experimental set up using xenografted MCF7 cells. h Kinetics of tumor growth for MCF7 cells stably expressing shPAK4 or shControl injected subcutaneously onto the back of nude mice (shControl n = 8 and shPAK4 n = 10). i Quantification of tumor weight at the experimental endpoint (shControl n = 8 and shPAK4 n = 10). j Representative X-Gal-stained wholemount tumor slices of the indicated groups. k Correlation between PAK4 expression and the proliferation score of breast tumors in the METABRIC breast cancer cohort (n = 1992). Data are represented as mean ± SEM in c, f, h, and i. p-values by two-tailed unpaired t test are indicated in c, f, and i and by two-way ANOVA (repeated measurements) followed by Bonferroni's multiple comparisons post hoc test in h. The Spearman correlation and p-value by Spearman’s test are indicated in k. The colored dots represent the PAM50 subtypes as displayed in Fig. 1b

