Fig. 7.
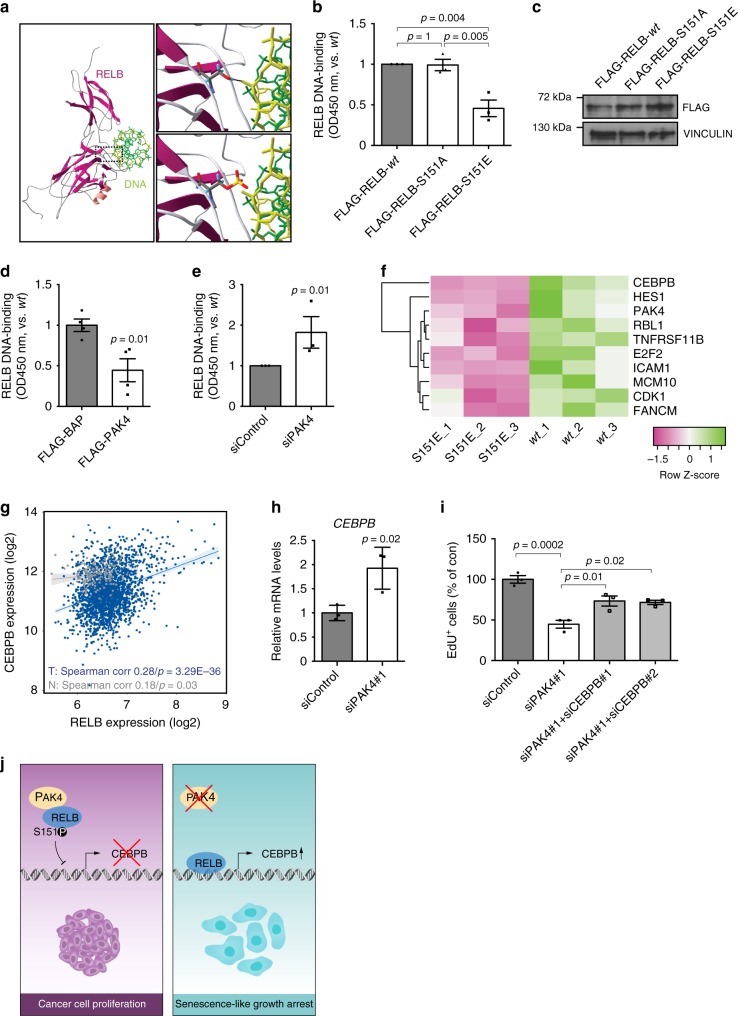
RELB–Ser151 phosphorylation controls DNA-binding and C/EBPβ transcription. a Structure of RELB:κB DNA complex (PDB ID: 3DO7) highlighting RELB–Ser151 in close proximity to DNA, the RELB subunit shown in purple and DNA in greens. Top inset zooms into Ser151 and shows a hydrogen bond with the DNA backbone. Bottom inset models the disturbing impact on DNA binding of Ser151 phosphorylation. b ELISA-based measurements of RELB DNA-binding 24 h upon expression of the indicated constructs in Hs 578T cells (n = 3 per group). c Representative immunoblot for experiments quantified in b using VINCULIN as loading control. d ELISA-based measurements of RELB DNA-binding in MCF7 cells stably expressing the indicated constructs (n = 4 per group). e ELISA-based measurements of RELB DNA-binding 4 days after the indicated siRNA transfections in Hs 578T cells (n = 3 per group). f Differentially expressed genes from an RT-qPCR array performed in Hs 578T cells transfected with FLAG-tagged RELB–S151E and RELB-wt (n = 3 per group). Statistically discernible hits (Supplementary Fig. 7c) are ordered by Fold Change. g Correlation between the expression of C/EBPβ and RELB in tumors (T) and normal tissue (N) in METABRIC. h RT-qPCR analyses of C/EBPβ mRNA in Hs 578T cells 72 h after the indicated siRNA transfections (n = 3 per group). i Quantification of EdU+ cells in Hs 578T cells 4 days after the indicated siRNA transfections (n = 3 per group). j Schematic summary diagram. In proliferating cancer cells, abundant PAK4 contributes to senescence avoidance. PAK4 inhibits RELB by direct interaction and phosphorylation of RELB–Ser151 thereby impairing binding affinity to DNA. In the absence of PAK4, RELB accumulates and binds DNA, which culminates in the expression of senescence regulators including C/EBPβ. Data are represented as mean ± SEM in b, d, e, h, and i. p-values by one-way ANOVA followed by Tukey's post hoc test in b and by two-tailed unpaired t tests in d, e, h, and i are indicated. The Spearman correlation and p-value by Spearman’s test are indicated in g for tumors (T, blue, n = 1992) and normal tissue (N, gray, n = 144)

