Fig. 3.

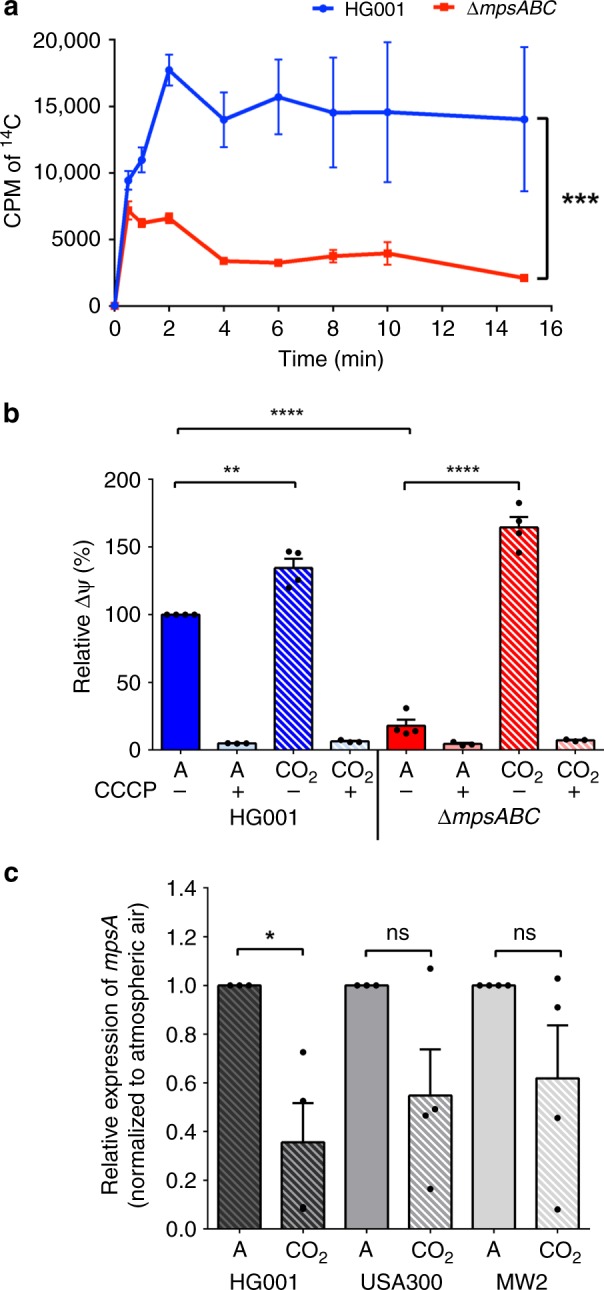
Uptake of NaH14CO3 by HG001 and ΔmpsABC, membrane potential determination and mpsA expression. a Cells were preincubated with fluorocitrate for 30 mins prior to the addition of NaH14CO3 (50 μCi). NaH14CO3 was added at time 0 and 1 ml of cell samples collected at times indicated. The H14CO3 uptake was determined by 14C accumulation in cells measured by liquid scintillation counting. The NaH14CO3 uptake in ΔmpsABC was significantly lower than WT HG001; ***p < 0.001 by paired two-sided t-test. Each point shown in the graph represents the mean value ± standard error mean (SEM) from three independent experiments. (CPM = counts per minute). b ∆mpsABC grown in 5% CO2 showed increased membrane potential compared with those grown in atmospheric conditions. Membrane potential was determined by fluorescence intensity measurements using BacLight bacterial membrane potential kit. The values for WT HG001 in atmospheric were set equal to 100%. Cells were grown to exponential growth phase in atmospheric (A) and 5% CO2 (CO2). As a negative control, the H+ ionophore CCCP caused a collapse of the membrane potential in all strains tested both in atmospheric CO2 and in the presence of 5% CO2. When grown under 5% CO2 conditions, HG001 and ∆mpsABC showed significantly higher relative membrane potential (**p < 0.01 and ****p < 0.0001, respectively, as determined by unpaired two-sided t-test) compared with their corresponding strains in atmospheric conditions. Each bar shown in the graph represents the mean value ± standard error mean (SEM) from four independent experiments (three independent experiments for CCCP), each with three technical replicates. c mpsA expression in three wild-type Staphylococcus aureus strains HG001, USA300, and MW2 under atmospheric and 5% CO2 conditions. The relative expression of mpsA under 5% CO2 conditions, normalized to its corresponding strains grown in atmospheric (A) conditions. Only mpsA expression in HG001 is significantly lower in 5% CO2 compared with atmospheric conditions; *p < 0.05 by unpaired two-sided t-test. (ns = not significant). Each bar shown in the graph represents the mean value ± standard error mean (SEM) from four independent experiments, each with three technical replicates. Source data are provided as a Source Data file
