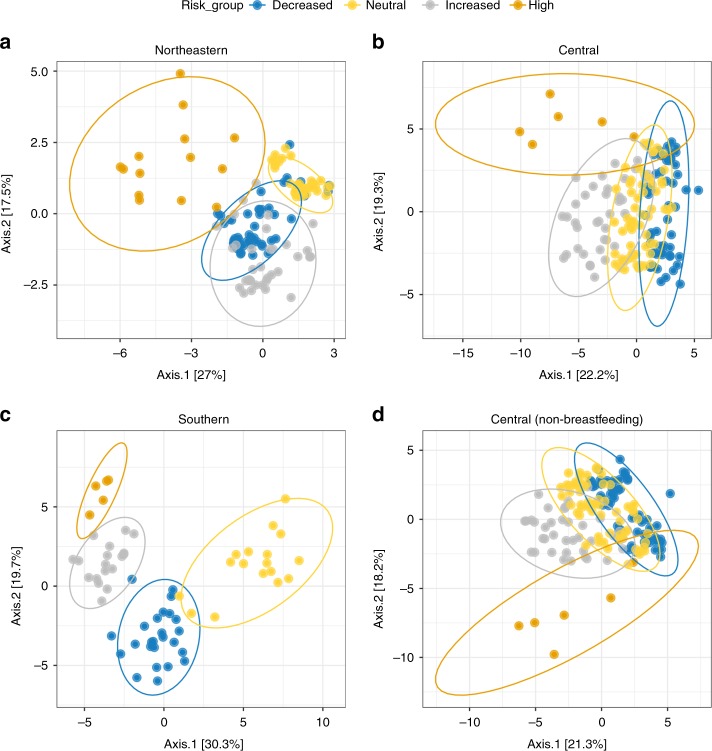
Fig. 6.
Prevalent ASV clusters vary by HLA genotype across geography. a–d PCoA of inter-subject binomial distances for each of the three geographical clusters after applying 45% prevalence filter: a the Northeastern, b the Central, and c the Southern region. d Central region 45% prevalence after removal of samples from participants still breastfed at the time of sample collection. Ellipses are calculated based on a 95% confidence for each group

