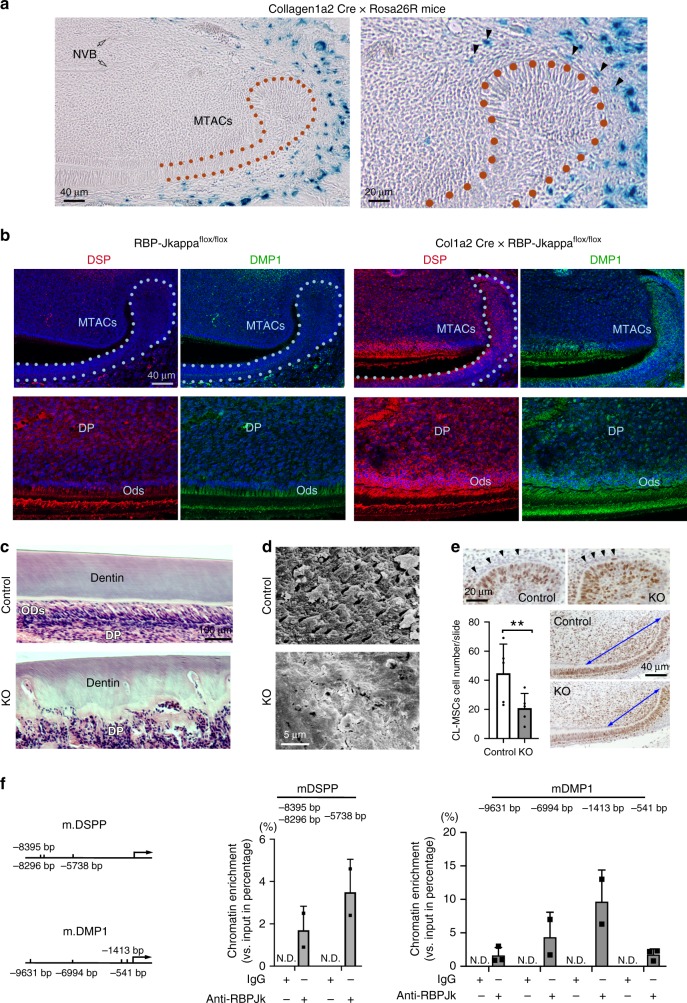
Fig. 5.
Loss of Notch pathway in CL-MSCs has impacts on MTACs and cell differentiation. a Representative LacZ staining on the P7 Collagen1α2 Cre × Rosa26R mouse lower incisor. Right panel represents the enlarged CL region of the left panel. Black arrows indicate the LacZ-positive cells in the CL-MSCs. Hollow arrows indicate the NVB region. b Immunofluorescence analysis of DSP and DMP1 expression in the Collagen1α2 Cre × RBP-Jkappa flox/flox mice incisor CL region vs. controls (RBP-Jkappa flox/flox). Nuclei were counterstained with DAPI. Light blue dotted lines indicate epithelial–mesenchymal junctions. c Hematoxylin–eosin staining of the Collagen1a2 Cre × RBP-Jkappa flox/flox (indicated as KO) mice incisor CL region vs. controls (RBP-Jkappaflox/flox, indicated as Control). Note the highly disturbed dentin formation. DP dental pulp, Ods odontoblasts. d Scanning electron microscopy micrographs on the 2-month-old Control and KO mouse incisor dentin. e Analysis of CL-MSCs and MTACs cell number in the Control and KO mice with Ki67 immunohistochemistry analysis (positive signal is visualized with brown DAB substrate). Two-way ANOVA followed by Bonferoni correction was performed. **p < 0.01. Blue double-arrow-end lines outline the TAC regions contacting epithelium. f Chromatin IP analysis of RBP-Jkappa binding to the predicated sites (left) at mouse DSPP and DMP1 gene promoters. The numbers represent the distance of the binding sites to the gene transcription starting site. The protein precipitation was performed using specific anti-RBP-Jkappa antibodies, with IgG as control. ND: not detected. Genomic DNA were extracted from n = 5 biologically independent animals and pooled. Triplicated samples were used for real time PCR analysis. Error bars represent standard deviation. Bars: a (left panel) and b: 40 μm; a (right panel) and e: 20 μm; c: 100 μm; d: 5 μm

