Fig. 7.
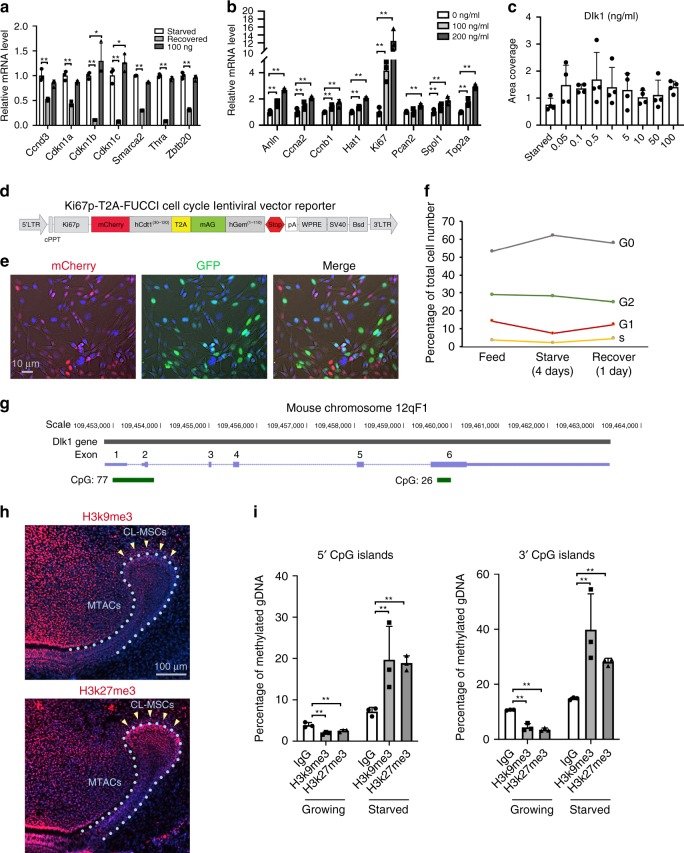
MTACs feedback to CL-MSCs through Dlk1. a, b Real time RT-PCR analysis of the indicated markers in the MO6-G3 cells cultured under bound (a, coating the protein onto cell culture dish first before seeding cells) and free form of Dlk1 (b, by adding directly on top of cultured cells). Cells were starved for nutrients for 4 days before recovery or Dlk1 treatment for 24 h as indicated. The results were from n = 3 biologically independent samples. Two-way ANOVA followed by Bonferoni correction was performed. No asterisk: p > 0.05; *p < 0.05; **p < 0.01. c Colony areas coverage of the soluble Dlk1-reated cells as indicated in b. The results were from n = 3 biologically independent samples. d Design of a new Ki67p-T2A based FUCCI cell cycle indicator. e Representative images of MO6-G3 cells incorporated with the Ki67p-T2A-FUCCI cells. Images were taken under phase contrast setting. f Flow cytometry analysis of MO6-G3/Ki67p-T2A-FUCCI cells at different cell cycle phase under indicated culture condition. g Illustration of genomic location of mouse Dlk1 gene and its 5′ and 3′ CpG islands (green) and number. The positions of exons are indicated in purple. h Immunofluorescence analysis of H3k9me3 and H3k27me3 in the P7 mouse incisor. Nuclei were counterstained with DAPI. Yellow arrows mark clusters of odontoblasts that were EGFP positive. Light blue dotted lines indicate epithelial–mesenchymal junctions. i Methylation analysis of mouse Dlk1 gene CpG islands in the MO6-G3 cells at growing and starved conditions. Genomic DNA were extracted from n = 3 biologically independent samples. Two-way ANOVA followed by Bonferoni correction was performed. **p < 0.01. Error bars represent standard deviation. Bars: e: 10 μm; h: 100 μm

