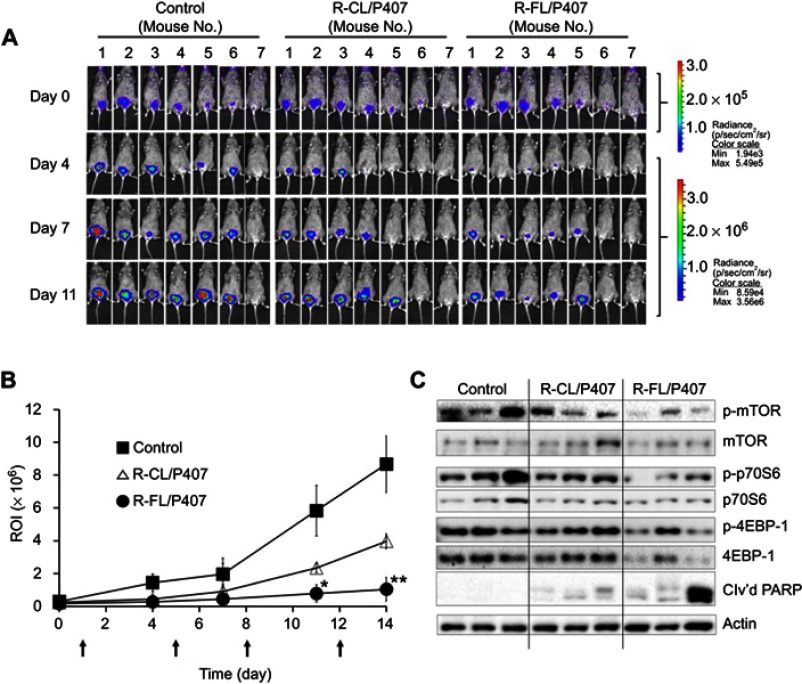
Figure 8.
Comparison of in vivo antitumor efficacy of different samples in the orthotopic bladder cancer model in C3H mice.
Notes: (A) In vivo imaging acquired via BLS. For statistical analyses, tumor bioluminescence following treatment was normalized against the initial bioluminescence on day 4. (B) ROI-time plots for quantitative comparison (*P<0.05, **P<0.01 versus R-CL/P407). Arrows indicate instillations. Data represent the means ± SD (n=7). (C) Inhibition of mTOR signaling and induction of cleaved PARP. The blots are representative of three independent experiments.
Abbreviations: R, rapamycin; R-CL, rapamycin-loaded conventional liposome; R-FL, rapamycin loaded folate-modified liposome; P407, poloxamer 407; BLS, bioluminescence signal; ROI, region of interest.

