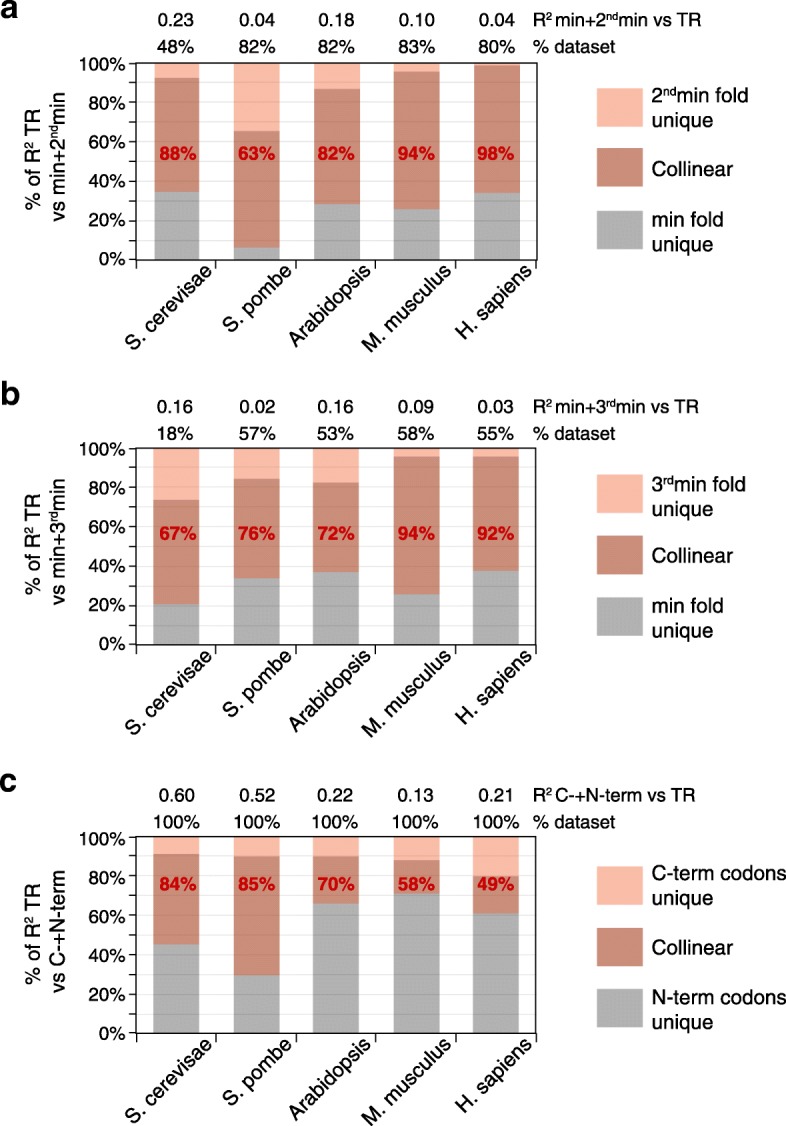
Fig. 10.

Collinear control between differently located RNA segments. a A model was built for the combined control of translation rate (TR) by both the most highly folded window (min) and the non-overlapping second most highly folded window (2ndmin). The R2 coefficients for these combined features vs log10 TR are given (top). The percent of the unique and collinear contributions of “min” and “2ndmin” to the total variance in translation explained by the model for both features is shown by length on the y-axis. The percent of control of TR by “2ndmin” that is collinear with control by “min” is shown in red text. The percent of genes in the dataset whose 5′ regions are long enough to contain the two non-overlapping windows used in the analysis are indicated (top). b The collinearity between the most highly folded window (min) and the non-overlapping third most highly folded window (3ndmin) is displayed as described in a. c The collinearity between regulation of translation by codon frequency in the N-terminal half of each protein (N-codon) and C-terminal half of each protein (C-codon) is shown as described in a, except that the percent of control of TR by “C-codon” that is collinear with control by “N-codon” is shown (red text), and 100% of genes in each dataset were used (top)
