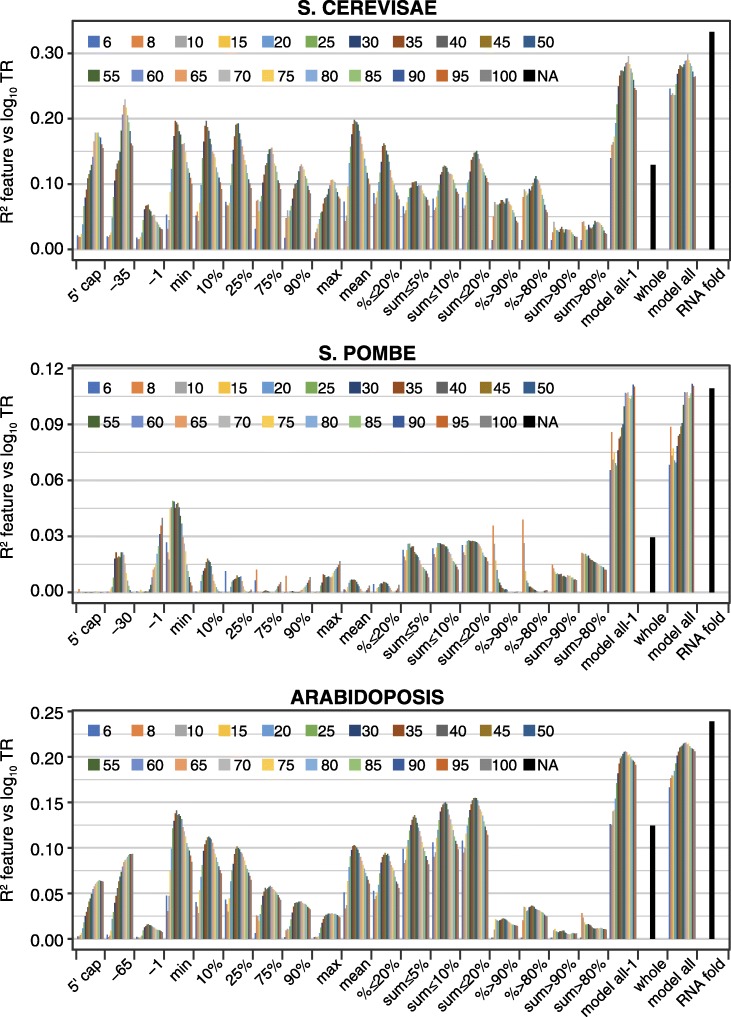
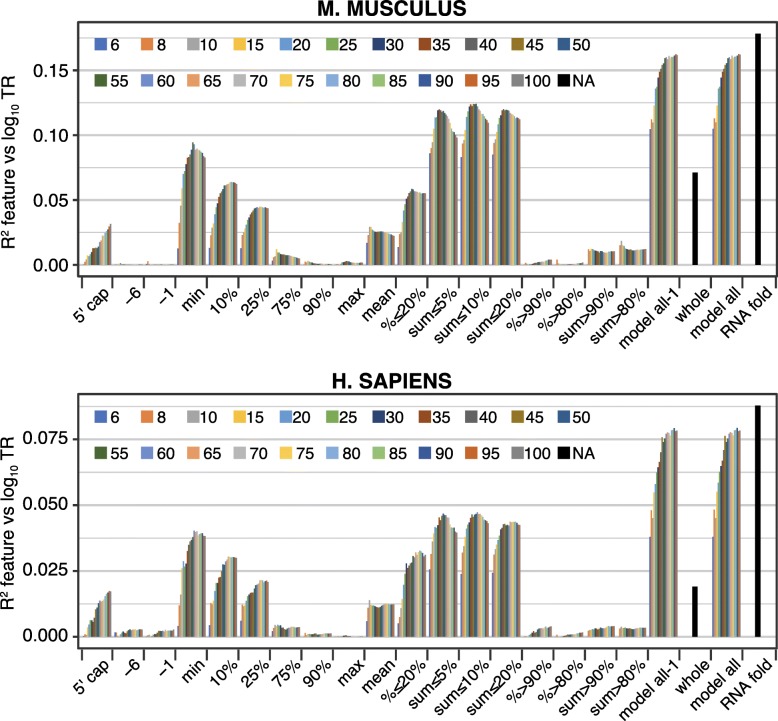
Fig. 2.
Translation rates are optimally determined by a combination of RNA folding features. The R2 coefficients of determination between log10 translation rates (TR) and a variety of single features and feature sets based on RNA folding energies. Nine features use the free energy value of a single window per gene (left): windows “5′ cap” through “− 1” were identified by the location of their 5′ most nucleotide, while windows “min” through “max” were identified by the rank of their free energy. Nine additional features were each calculated using multiple windows per gene (center): “mean,” the mean of all windows in a gene; “% ≤ 20%,” “% ≥ =90%,” and “% ≥ 80%,” the percent of windows in a given gene that respect a threshold on the free energy of all windows for all genes; and “sum ≤ 5%,” “sum ≤ 10%,” “sum ≤ 20%,” “sum ≥ 80%,” and “sum ≥ 90%,” the sum of free energies of windows in a given gene that respect a threshold on the free energy of all windows for all genes. Twenty one window lengths from 6 to 100 nucleotides were employed for each of the above features. In addition, a final feature, “whole” (right), was calculated from the free energy of folding of the contiguous sequence from the 5′cap to + 35 for each mRNA. Three multivariate feature sets were also determined (right): “model all-1” combined all window-based features for a given window length; “model all” included in addition the “whole” feature; while “RNAfold” used Bayesian Information Criteria to select features from the complete set of features, using whichever window length variant(s) provided the most useful information. “RNAfold” was additionally constrained for S. pombe by removal of all windows that extend 3′ of + 30 nucleotides to avoid sequences showing a strong negative correlation of free energy values and TR. Additional file 4 provides the R2 values for all features. Additional file 5 provides details of the features selected for the “RNAfold” model


