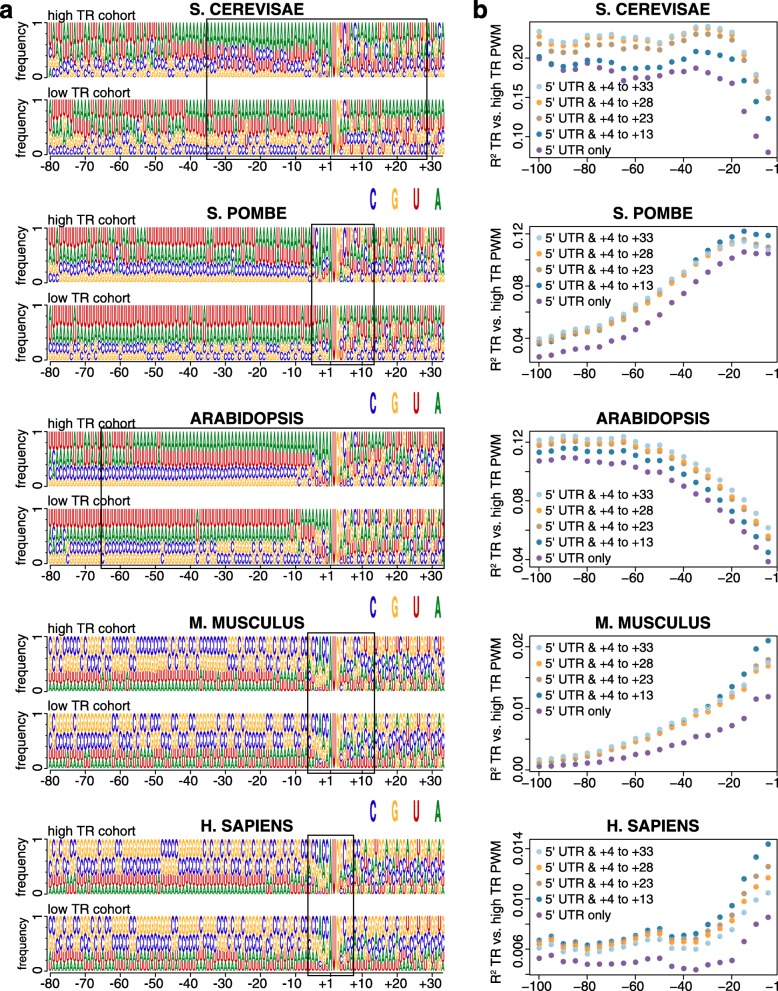
Fig. 4.
The 5′ and 3′ boundaries of AUG proximal elements. a Position Weight Matrices (PWMs) for the 10% of mRNAs with the highest translation rate (high TR cohort) and the 10% with the lowest rate (low TR cohort). Sequence logos show the frequency of each nucleotide at each position relative to the first nucleotide of the iAUG. The location of the AUG proximal element (APE) is indicated with a black box. b The R2 coefficients of determination between log10 translation rates (TR) and PWM scores. PWMs of varying lengths were built from the sequences of the high TR cohort, the PWMs extending 5′ from − 1 in 5 nucleotide increments and extending 3′ from + 4 in 5 or 10 nucleotide increments. Log odds scores were then calculated for all mRNAs that completely contained a given PWM. Additional file 1: Figure S6 shows more detailed mapping of the 5′ and 3′ boundaries for M. musculus and H. sapiens. The frequencies of nucleotides in the PWMs are given in Additional file 7

