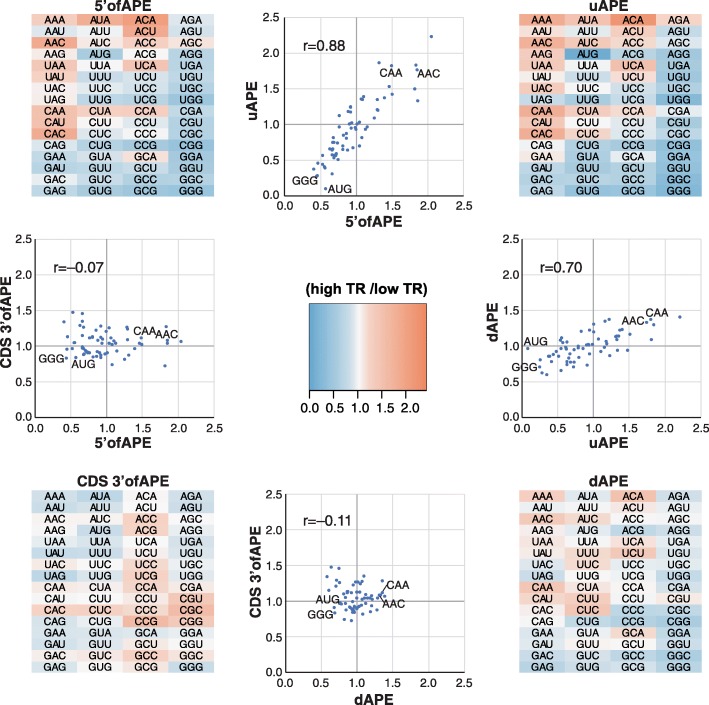
Fig. 5.
Correlations between regulatory regions in Arabidopsis mRNAs. The four heat maps show the frequency of each tri-nucleotide in the most highly translated 10% of genes divided by its frequency in the most poorly translated 10% of genes (high TR/low TR ratio). Ratios were calculated for four separate parts of the mRNA: 5′ofAPE, uAPE, dAPE, and the CDS 3′ofAPE. Scatter plots show the correlation in high TR/low TR ratios between the selected regions. The Pearson correlation is given. Data points for four tri-nucleotides are indicated (GGG, AUG, CAA, AAC). Strong positive correlates are seen between 5′ofAPE and uAPE and between uAPE and dAPE. CDS 3′ofAPE only correlates weakly with the other regions, consistent with its different function

