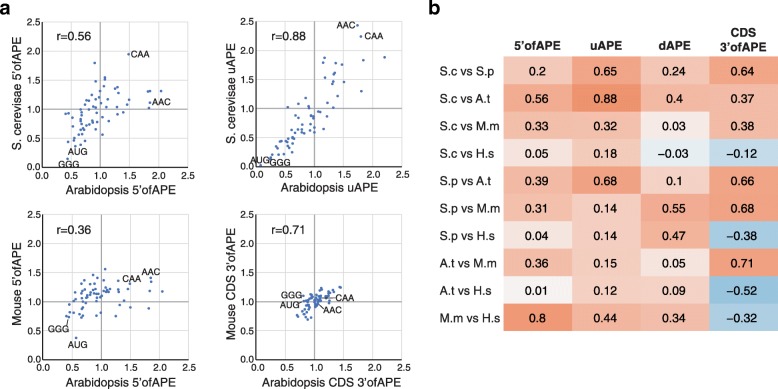
Fig. 6.
Correlations between translational cis-regulatory sequences in different species. a Scatter plots showing strong correlations between (TR high/TR low) tri-nucleotide ratios for selected genomic regions from different species. The Pearson correlations (r) are indicated. b Pearson correlation coefficients between each of the four mRNA regions among the five species. The color intensities are scaled to the correlation coefficient. Clear correlations are observed in many cases

