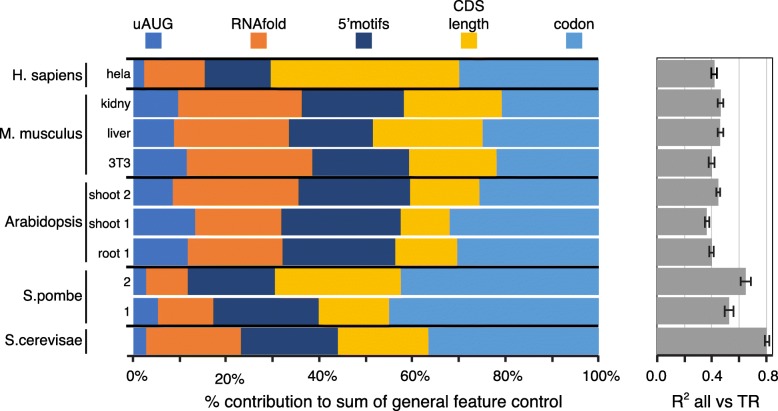
Fig. 8.
The contributions of general cis-control features in five species and several tissues. a For each feature or feature set separately, its R2 coefficient of determination vs log10 translation rate (TR) is given as a percent of the sum of the R2 coefficients for linear models for each of the five features. b The R2 coefficients between log10 TR and a multivariate linear model that combines the five features. The 95% confidence limits are shown for 1000× bootstraps with replacement. The R2 values and the values plotted for each feature and the combined model are given in Additional file 9

