Figure 2:

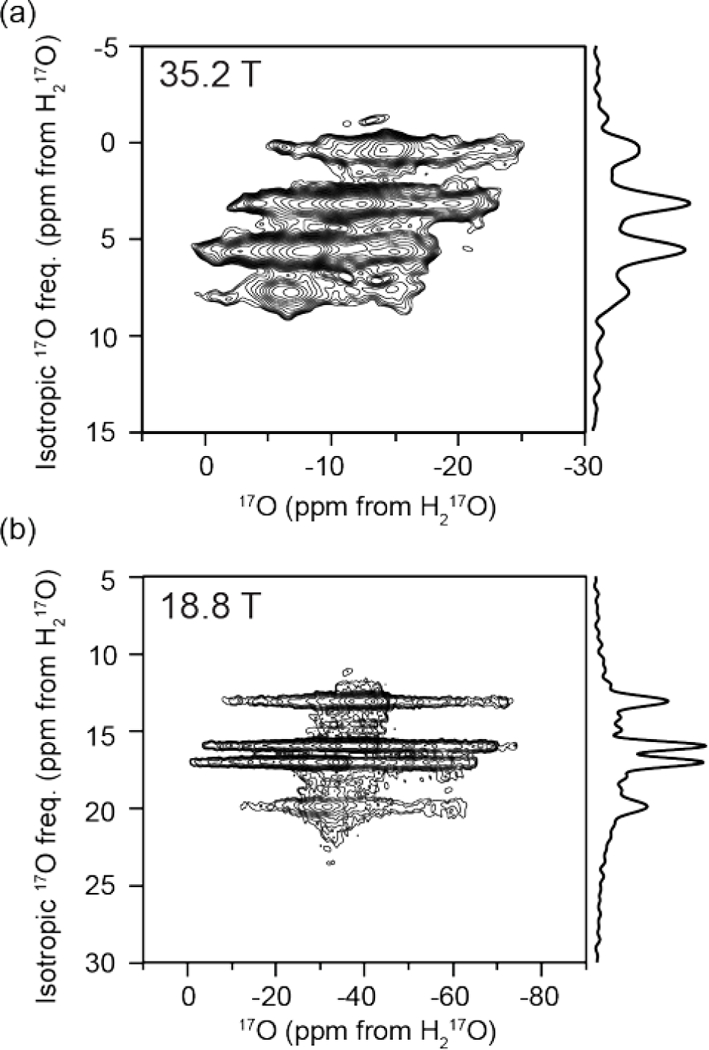
Oxygen-17 2D MQMAS NMR spectra at (a) 35.2 T (ω0H/2π = 1500 MHz) and (b) 18.8 T (ω0H/2π = 800 MHz). Four distinct water sites are resolved in each spectrum. The projection of the isotropic dimension is shown to the right of each spectrum.

Oxygen-17 2D MQMAS NMR spectra at (a) 35.2 T (ω0H/2π = 1500 MHz) and (b) 18.8 T (ω0H/2π = 800 MHz). Four distinct water sites are resolved in each spectrum. The projection of the isotropic dimension is shown to the right of each spectrum.