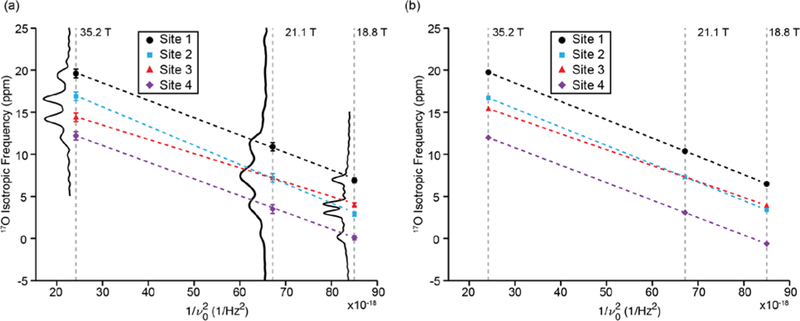
Figure 4:

Magnetic field dependence (Bo = 18.1 to 35.2 T) of the observed 17O isotropic frequency shown using the (a) observed isotropic frequency from the 2D MQMAS spectra, and (b) using the equationwhereand v0 is the Larmor frequency of 17O and is calculated from the values in Table 1. A projection of the isotropic dimension at each field is shown to the left of the isotropic frequencies for each field in (a). The dashed lines (Black, Red, Blue and Purple) are linear fitted lines to the isotropic frequencies of each site.
