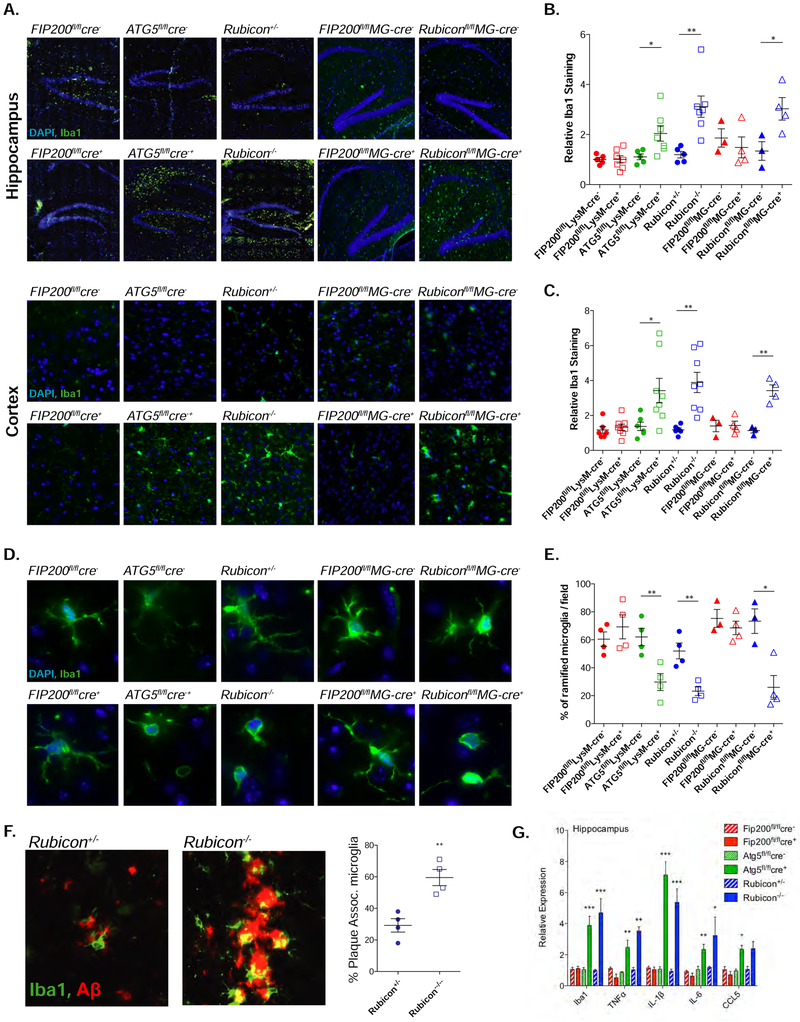
Figure 4. LANDO decreases Aβ-induced reactive microgliosis.
A. Representative images showing microglial activation/expansion (green-Iba1 positive) in the hippocampus and the 5th cortical layer (cortex) of the indicated 4m-old 5xFAD genotypes. Scale bars, 100μm.
B. and C. Quantification of activated microglia in the hippocampus (B) and cortex (C) respectively. Data shown is the MFI of Iba1 staining for each genotype relative to Wt, 5xFAD littermate controls. Each point represents an individual mouse.
D. Representative images indicating microglial morphology in 4m-old mice. Scale bars, 10μm.
E. Quantification of ramified vs. ameboid microglia in the indicated 5xFAD genotypes at 4m of age. Each point represents an individual mouse.
F. Representative images and quantification of microglia/plaque-association in 4m-old 5xFAD, Rubicon+/− or Rubicon−/− mice. (See STAR Methods). Each point represents an individual mouse. Scale bars, 5μm.
G. qPCR analysis of inflammatory gene expression in hippocampal slices from 4m-old 5xFAD mice of the indicated genotypes. n=7 mice per genotype, qPCR performed in triplicate.
Data are represented as mean ± SEM. Significance was calculated using Student’s t-test. *p<0.05, **p<0.01, ***p<0.001.

