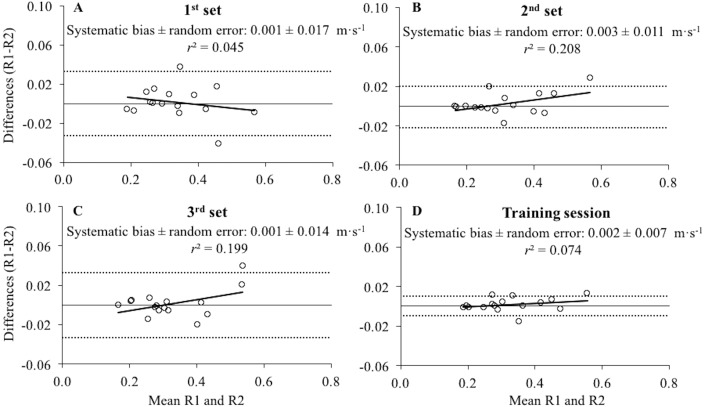
Figure 2. Differences between the raters for the mean velocity values collected during the first, second, third set and the whole training session.
Bland-Altman plots showing differences between the raters for the mean velocity values collected during the first set (A), second set (B), third set (C) and the whole training session (average value of the 3 sets; (D). Each plot depicts the averaged difference (straight line) and 95% limits of agreement (dashed lines), along with the regression line. r2, coefficient of determination.

