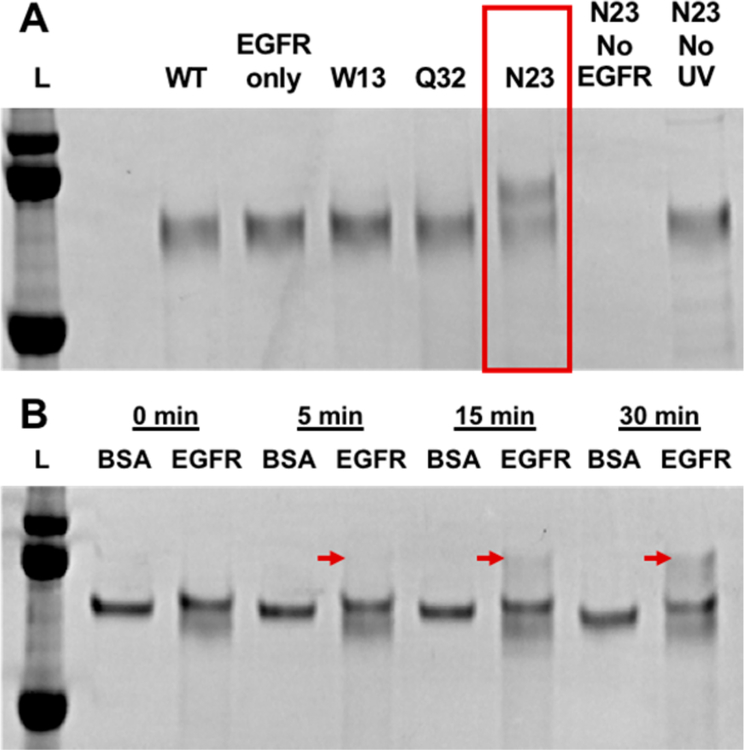
Figure 1.
(A) Denaturing polyacrylamide gel electrophoresis (SDS-PAGE) showing photo-cross-linking products of the affibody as indicated. All samples were treated with PNGase to degloycosylate and visualize EGFR extracellular domain (∼70 kDa) as a distinct band. Each sample contained both an affibody and EGFR fragment unless otherwise indicated. Note that only the N23BP mutant gave a photoproduct, which corresponded to a mass increase of 10 kDa. Ladder proteins are (top to bottom) 100, 75, and 50 kDa. (B) N23BP and EGFR mixed as in (A) or with the equimolar concentration (260 nM) bovine serum albumin (BSA) as indicated and irradiated for the time listed. A band corresponding to the EGFR-affibody conjugate appears at 5, 15, and 30 min (red arrows). Ladder proteins are (top to bottom) 100, 75, and 50 kDa.

