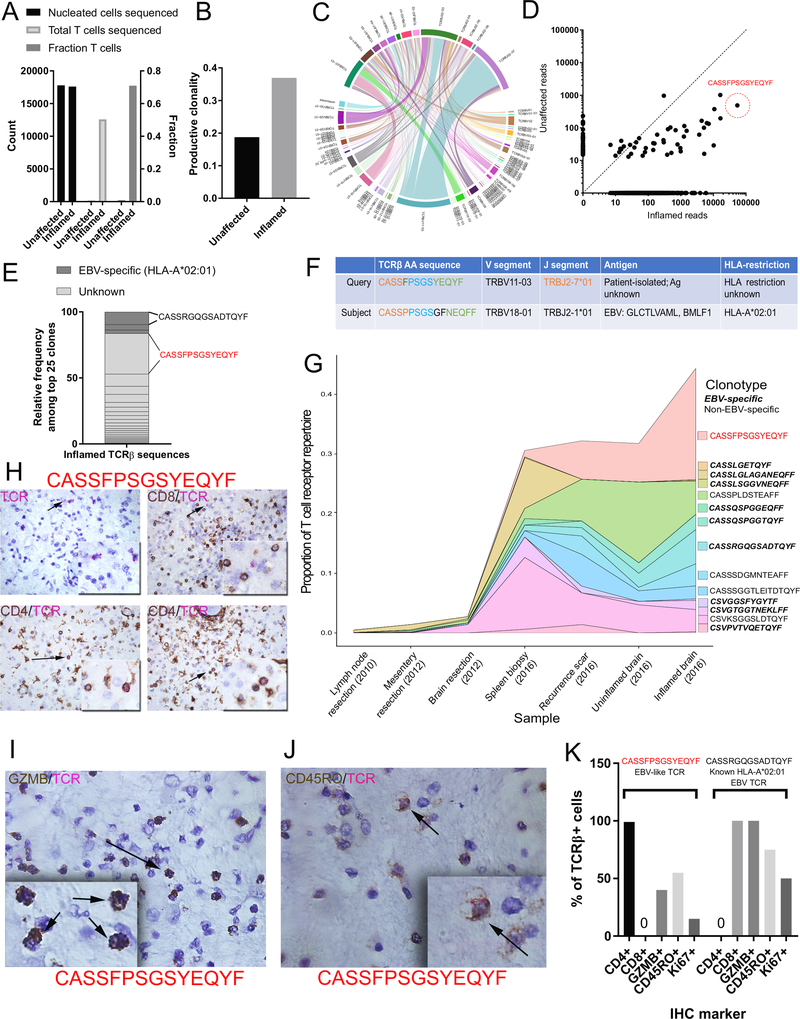
Figure 3: TCR sequencing identification of oligoclonal CD4+ cytotoxic T cells in inflamed encephalitic tissue.
A) ImmunoSEQ statistics of total cellular content, composition (fraction of T cells) and total T cells sequenced in inflamed and unaffected neural tissue. B) Enrichment of productive clonality in inflamed region of encephalitic tissue. C) Circos plot depicting the V(D)J rearrangements in TCRβ in the repertoire. D) Biplot demonstrating enrichment of shared TCRs among the unaffected (likely regional presence) and inflamed tissues. The amino acid sequence predicted from the most highly represented DNA sequence is identified (CASSFPSGSYEQYF). E) Representation of top 25 clones according to known EBV-specificity based on patient HLA haplotype. F) Sequence similarity in TCRβ amino acid sequence to a known EBV clone with specificity for the immediate-early HLA-A2-restricted epitopes GLC (BMLF1). G) Clonotype tracking over time and across tissue samples of EBV-specific and non-EBV-specific dominant clones found in the inflamed brain tissue. H) Dual IHC/RNA-ISH analysis for CD4/CD8 and EBV-like CASSFPSGSYEQYF RNA sequence. Upper left: only the TCR probe (pink); upper right: exclusion of TCR probe with CD8+ T cells, lower: Co-expression of CD4 with TCR probe. I) Co-expression of granzyme B with TCR probe J) Co-expression of CD45RO with TCR probe. K) Quantification for Ki67, CD45RO, and granzyme B (GZMB) expressed as percent of all CASSFPSGSYEQYF TCRβ+ cells, or the comparator CASSRGQGSADTQYF TCRβ sequence, a known HLA-A*02:01 restricted EBV clone.

