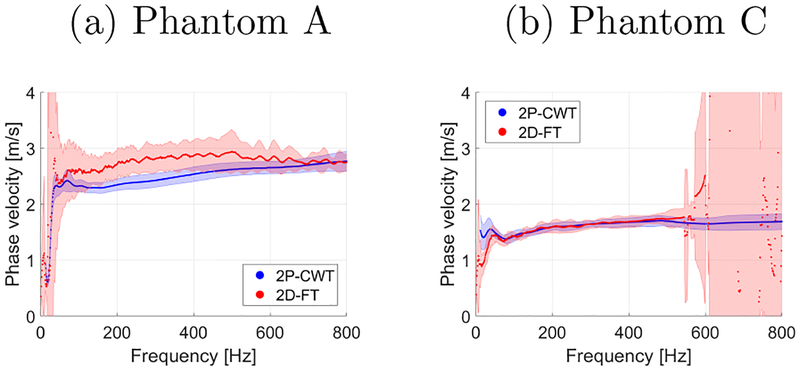
Figure 10:
Mean phase velocity dispersion curves from 12 acquisitions calculated for (a) Phantom A and (b) Phantom C, respectively. Results for Phantom A were calculated for first signal position of 4 mm and distance between positions (lateral segment length) of 2 mm. Results for Phantom C were computed for first signal position of 9 mm and distance between positions (lateral segment length) of 5 mm.

