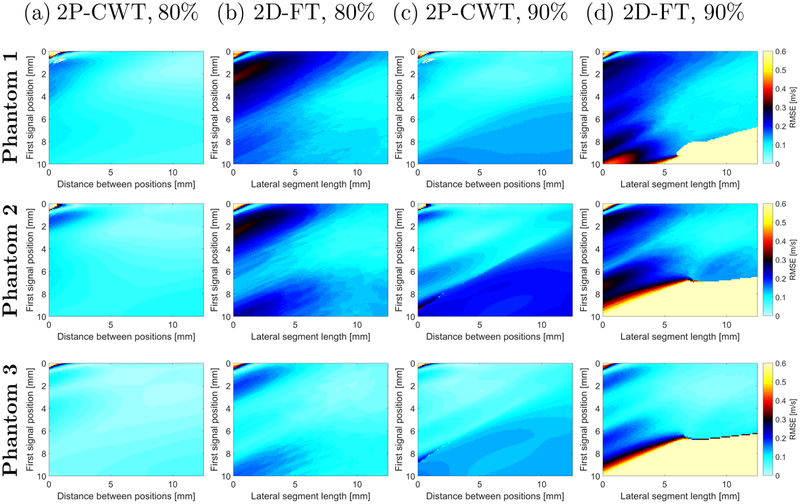
Figure 4:
The RMSE calculated in a frequency range from 100 Hz to the frequency corresponding to (a), (b) 80 % and (c), (d) 90 % of the maximum power spectra amplitude presented in Fig. 3a. The RMSE was computed for (a), (c) 2P-CWT and (b), (d) 2D-FT techniques. Results were calculated for the numerical LISA viscoelastic phantoms without added noise with assumed material properties (top row) μ1 = 4.99 kPa and μ2 = 1 Pa·s (Phantom 1). (middle row) μ1 = 3.34 kPa and μ2 = 1.25 Pa·s (Phantom 2). (bottom row) μ1 = 1.48 kPa and μ2 = 0.75 Pa·s (Phantom 3).

