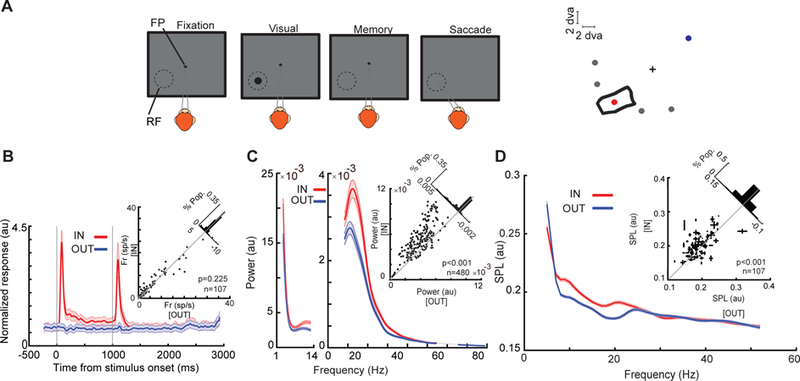
Fig. 1.

Changes in MT oscillatory power and spike timing during WM. (a) Schematic of the MGS task. The monkey fixates on a central fixation point (FP), and a cue stimulus appears in one of six positions arranged around the neuron’s RF location (right). The cue stimulus disappears, and the monkey maintains fixation throughout a blank delay period. Following the disappearance of the fixation point, the monkey saccades to the remembered location to receive a reward. (b) Firing rate of MT neurons does not change based on WM location. The bottom plot shows the normalized firing rate of 107 MT neurons across the course of the MGS task, when the memorized location is inside (IN, red) and outside (OUT, blue) of the neurons’ RFs. The upper-right scatter plot shows raw firing rates during the last 500 ms of the memory period, and diagonal histogram shows the distribution of firing rate changes. (c) αβ LFP power reflects WM location. The average LFP power spectrum during the memory period across frequencies (n = 480 LFP recordings), for memory IN (red) and memory OUT (blue) condition. The scatter plot shows αβ power (8–25 Hz) during memory IN vs. OUT. The diagonal histogram shows the distribution of differences in αβ power for all LFPs. (d) αβ SPL reflects WM location. The SPL for memory IN (red) and memory OUT (blue), across frequencies for all pairs of neurons and simultaneously recorded LFPs (n = 1,605 neuron-LFP pairs). Inset scatter plot shows the SPL at αβ for memory IN compared to memory OUT, with the SPL values for multiple simultaneously recorded LFPs averaged for each neuron (n = 107 neurons). Shading and error bars show standard error. Adapted from Bahmani et al. (2018)
