Fig. 2.

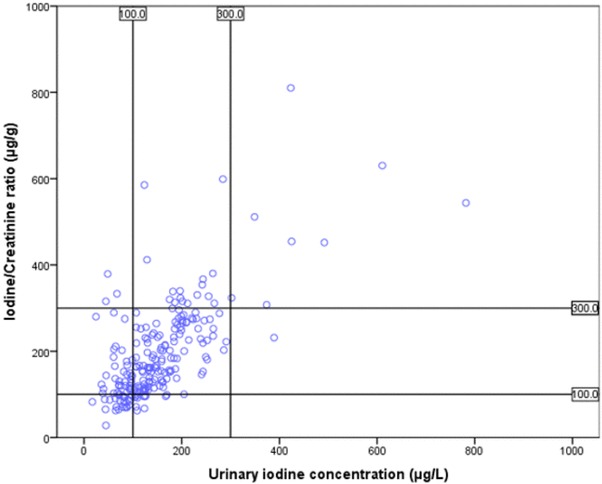
Distribution of urinary iodine concentration and estimated iodine/creatinine ratio among the children and how they are classified in relation to one another (N = 220). Each dot represents one child

Distribution of urinary iodine concentration and estimated iodine/creatinine ratio among the children and how they are classified in relation to one another (N = 220). Each dot represents one child