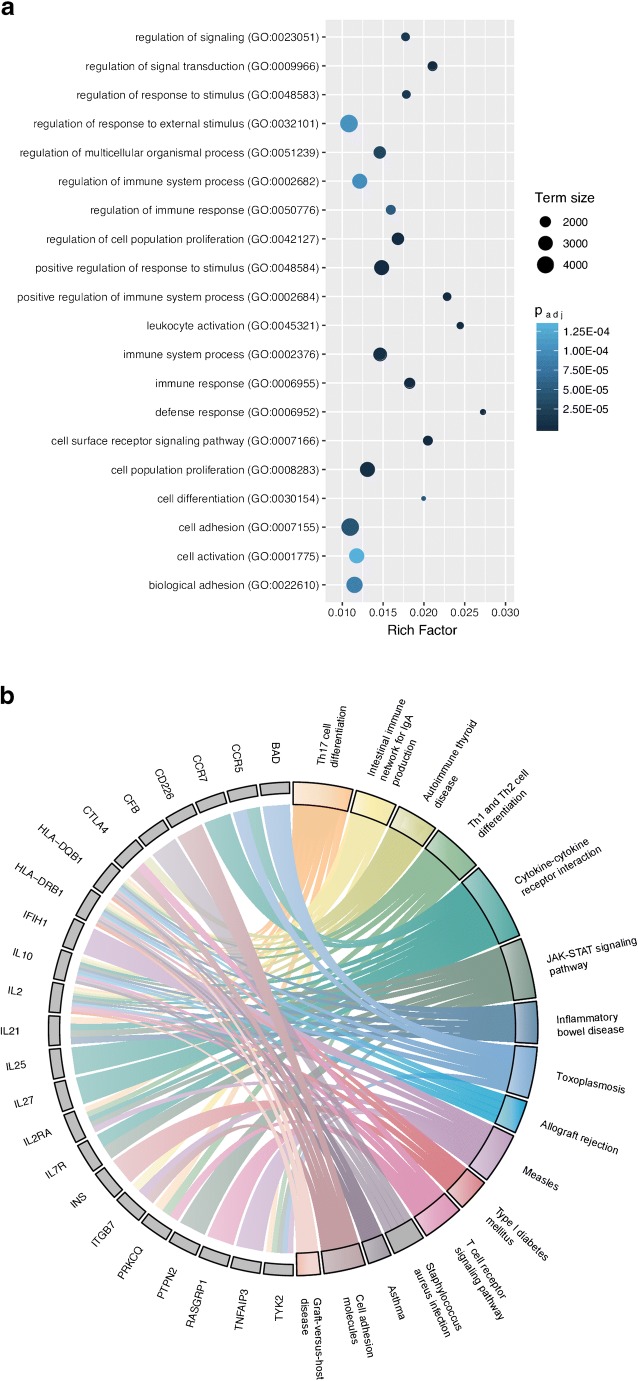
Fig. 1.
Gene Ontology (GO) and KEGG pathway analysis of T1D-related genes. a 118 genes obtained via the NHGRI-EBI Catalog and ImmunoBase were subjected to GO pathway overrepresentation analysis (“GO biological process”) using the program g:Profiler (Reimand et al., NAR, 2007) with default settings at Benjamini-Hochberg FDR of 0.05. The graph depicts the top 20 GO Slim categories (holding at least 1000 gene annotations) selected according to the lowest adjusted p value (p.adj). The genes categorized under GO:0002376 were used in the literature search to identify their involvement in viral infections and further subjected to KEGG pathway analysis (using g:Profiler) to gain a refined overview of their immune-related biological role. b The Circos plot depicts 23/46 of the genes (denoted with gray boxes) under GO:0002376 that had a KEGG pathway assigned (colored boxes). Graphs generated using the ggplot2 [143] and GOplot [144] packages in R, images modified using Inkscape 0.92 software

