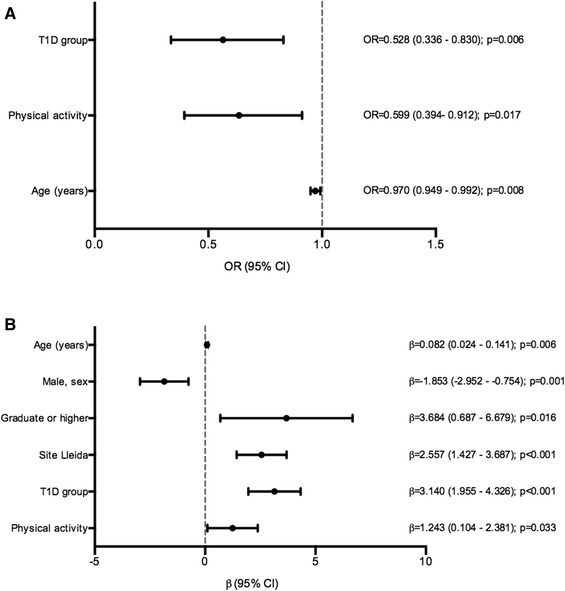
Fig. 1.

Multivariate analysis for the alternate Mediterranean Diet Score (aMED) and alternate Healthy Eating Index (aHEI) of the study groups. a Multivariate logistic regression for the aMED low group (0–2 points). Hosmer–Lemeshow test p value: 0.08. b Multivariate linear regression for the aHEI. Multiple R2: 0.16; adjusted R2: 0.14. T1D, type 1 diabetes
