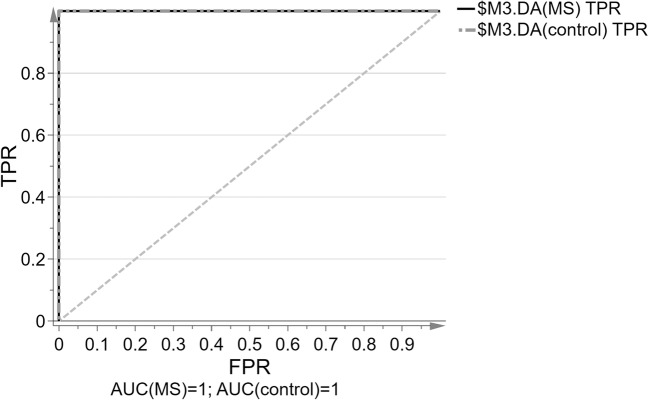
Fig. 4.
The ROC curve of the true positive rate (TPR) versus the false positive rate (FPR = 1-TNR) and ROC-AUC values for both groups as quantitative measure of the classification success for hydrophilic compounds for the OPLS-DA model; sensitivity: 100%, 95% CI = 82.35% to 100.00%; specificity: 100%, 95% CI = 82.35% to 100.00%

