FIG 5.
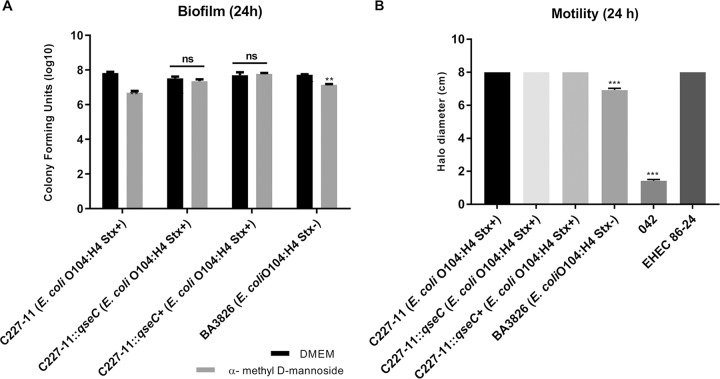
General phenotypic differences between EAEC strains during biofilm formation. (A) WT C227-11 (Stx+), ::qseC C227-11 (Stx+), qseC+ C227-11 (Stx+), and BA3826 (Stx–) strains on 96-well polystyrene plate in the presence or absence of 1% α-methyl d-mannoside incubated for 24 h at 37°C. (B) Motility profile between E. coli strains compared to WT C227-11 (Stx+) plated on LB agar 0.3% and incubated at 37°C. Growth halos were measured 24 h after incubation. Statistical analysis was performed using a Student t test between each group or ANOVA. Error bars indicate the SD of the mean (**, P < 0.001; ***, P < 0.0001; ns, not significant).

