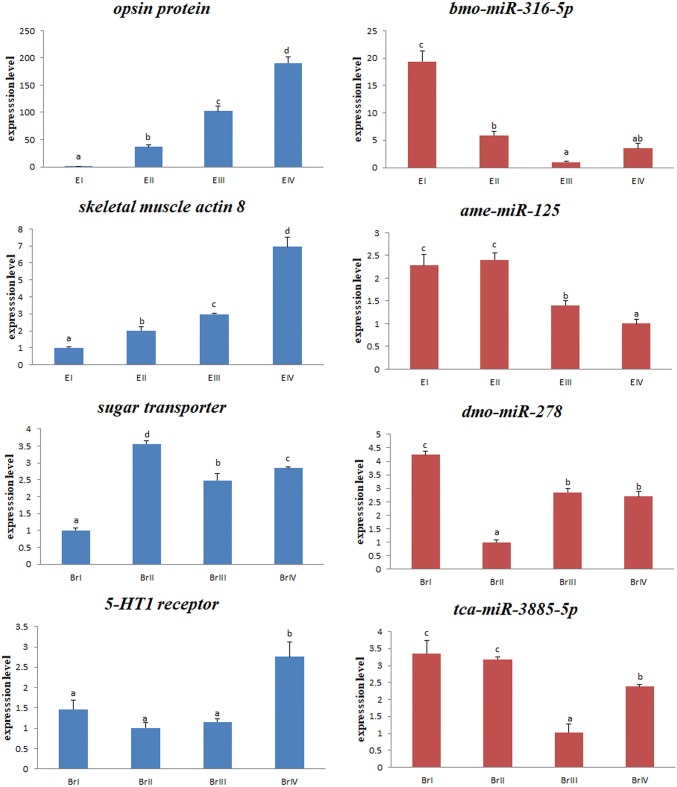
Fig. 7.
Expression analysis of selected miRNAs and their targets during different ovarian development stages using qRT-PCR. Expression changes are expressed as the ratio of gene expression after normalization to U6 and β-actin. E: eyestalk; Br: cerebral ganglia. Stage I (undeveloped stage, oogonium proliferation, transparent), stage II (developing stage, primary vitellogenesis, yellow), stage III (nearly ripe stage, secondary vitellogenesis, light green), and stage IV (ripe stage, vitellogenesis termination, dark green)

