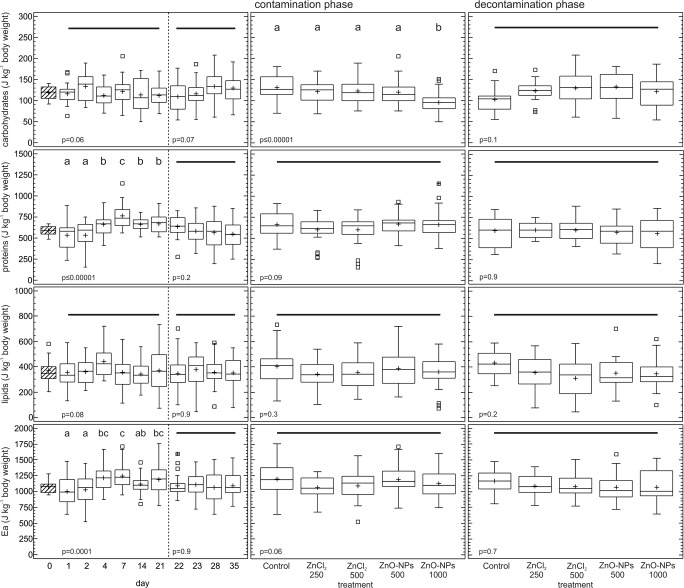
Fig. 1.
Effects of Zn on the available energy reserves (Ea), proteins, carbohydrates, and lipids in Eisenia andrei earthworms exposed to Lufa 2.2 soil contaminated with different effective concentrations (EC25 and EC50 for reproduction) of ZnO nanoparticles (NPs) or ions (ZnCl2). Boxes—lower and upper quartiles, whiskers—extend to the minimum and maximum values, plus sign—mean value, center line—median, empty squares (outliers)—between > 1.5 and 3 times the interquartile range, squares with crosses (far outliers)—more than 3 times the interquartile range. Shading indicates day 0, which was shared by all the treatments. The vertical broken line indicates the start of the decontamination phase. Different letters indicate significant differences (LSD, p < 0.05), and the solid horizontal line indicates that there was no difference between the treatments

