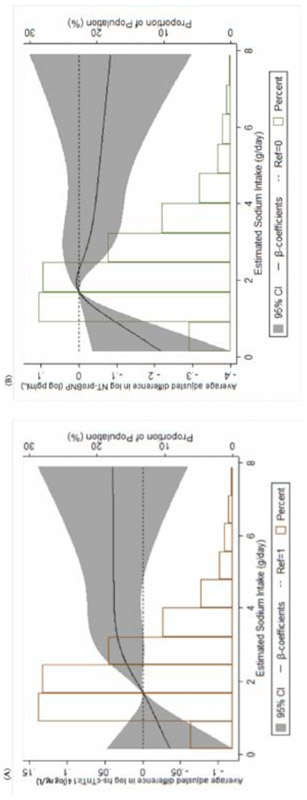
Figure 2 (A-B):

Panel A shows a restricted-cubic-spline plot of the association Between estimated sodium intake and hs-cTnT (log transformed) at MESA Exam 1. Panel B shows a restricted-cubic-spline plot of the association between estimated sodium intake and NT-proBNP (log-transformed) at MESA Exam 1. 95% confidence intervals are depicted within the span of the gray bars. All results are presented following multivariable adjustment.
