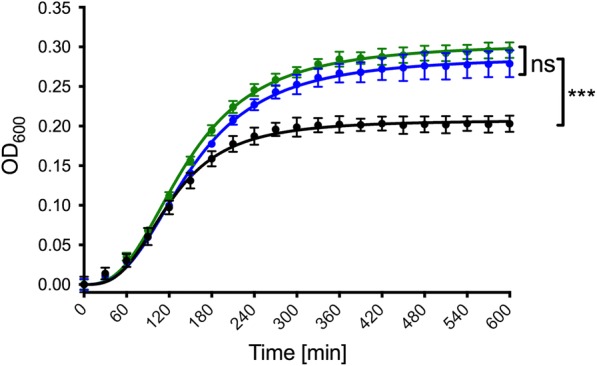
Fig. 1.

Net growth curves of E. coli C41(DE3) (black line), E. coli C41(DE3)∆(ompF) (blue line) and E. coli C41(DE3)∆(ompF-acrAB) (green line). The final ODs were analyzed using a one-way ANOVA followed by a Tukey multiple comparisons test. Error bars represent SD of two individual measurements. ns: not significant, ***p < 0.001
