. 2019 Jul 3;33(4):1193–1201. doi: 10.21873/invivo.11590

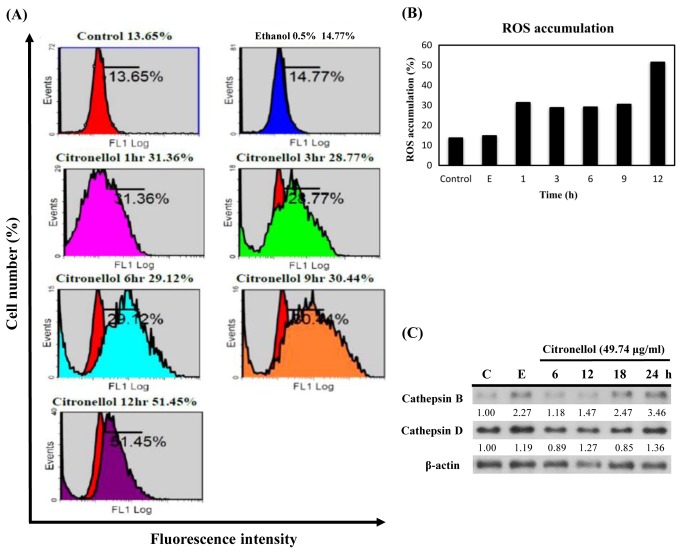
Figure 2. Citronellol induced ROS accumulation in NCI-H1299 cells. (A) NCI-H1299 treated with 49.74 μg/ml citronellol for 1, 3, 6, 9 and 12 h. Cells were stained with H2DCF-DA and fluorescence intensity of DCF was detected by flow cytometry. Control: 24 h + medium, Ethanol 0.5%: 24 h + Ethanol 0.5% + medium. (B) ROS accumulation was quantified by Multicycle software; X-axis represents the time to treat citronellol and Y-axis represents the fluorescence intensity of DCF (proportional to ROS accumulation). (C) NCI-H1299 cells were treated with 49.74 μg/ml citronellol for 6, 12, 18 and 24 h, followed by western blot analysis for cathepsin B and D expression. β-actin was used as the loading control and the numbers below represented the relative protein quantitation. Control: 24 h + medium, E: 24 h + Ethanol 0.5% + medium. The experiments were repeated at least three times.

Figure 2