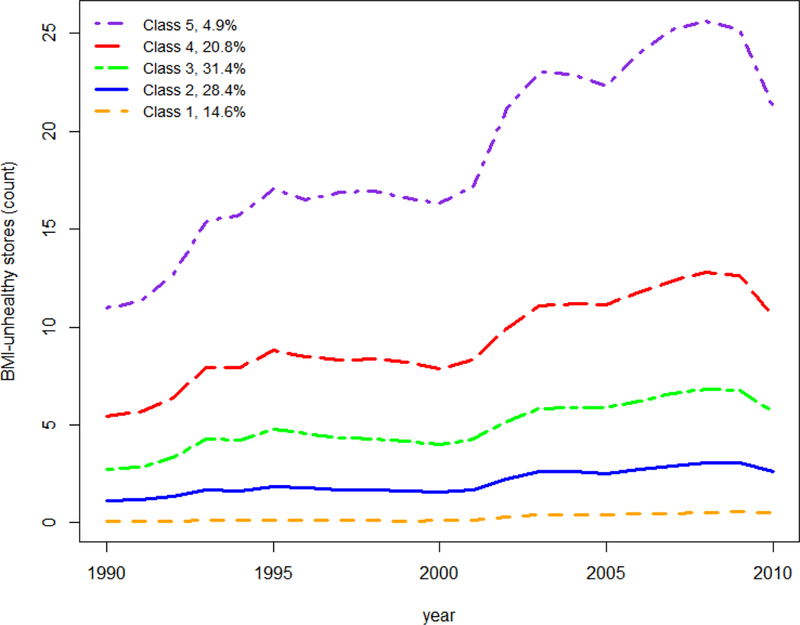
Figure 1 -.

Five Class-solution representing trajectories of the number of BMI-unhealthy food outlets at census tract level in New York City. Results are from Latent Class Growth Analysis with a 5-class solution, a quadratic growth function and a zero-inflated Poisson distribution (n=2,167).
