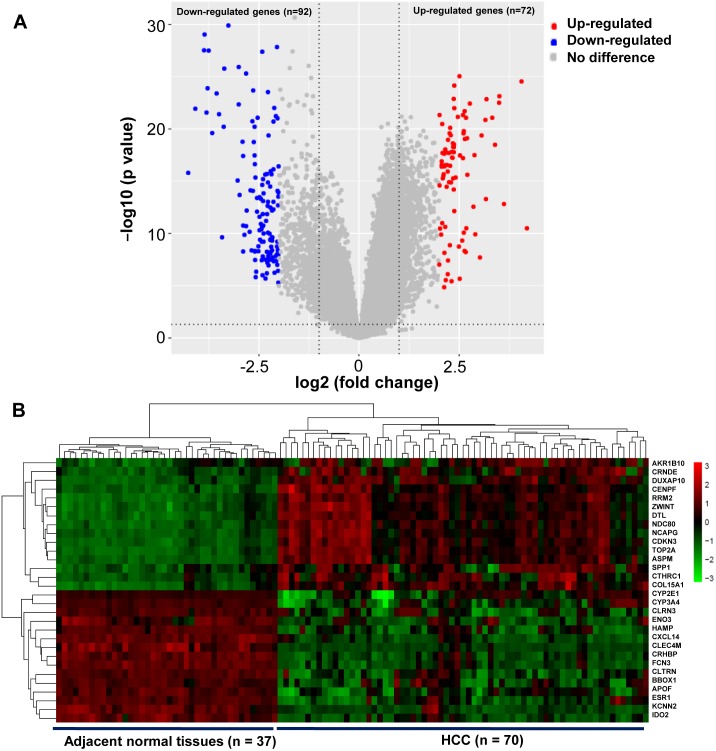
Figure 1. Identification of DEGs in HCC.
(A) Volcano plot of gene expression profile. The upper-right red dots represented upregulated genes, and the upper-left blue dots represented downregulated genes. (B) Hierarchical clustering heatmap of the 30 representative DEGs screened on the basis of —fold change— > 2.0 and P-value < 0.05. The columns represented the samples, including 37 adjacent normal and 70 HCC tissues. The rows showed that the 30 representative DEGs, including top 15 upregulated expressed genes, and the last 15 downregulated expressed genes in HCC. Red indicated that the expression of genes was relatively upregulated, and the green indicated the expression of genes was relatively downregulated.

