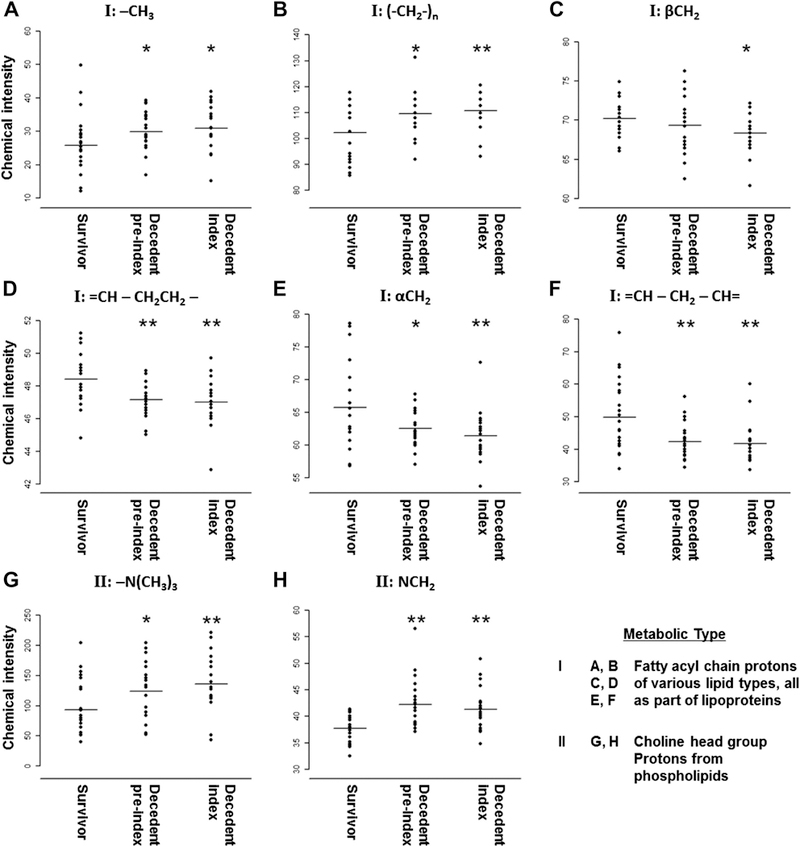
Fig 3.

Concentration levels of substructures of lipid molecules from plasma samples of survivors and decedents. Quantified were: A, –CH3 signal at 0.7 parts per million (ppm). B, (–CH2–)n signal at 1.3 ppm. C, βCH2 signal at 1.45 ppm. D, CH–CH2CH2– signal at 1.95 ppm. E, αCH2 signal at 2.2 ppm. F, CH–CH2–CH signal at 2.82 ppm. G, –(NH3)3 signal at 3.26 ppm. H, NCH2 signal at 3.6 ppm. Statistically significant levels for comparison between survivor and preindex decedent and comparison between survivor and index decedent samples are indicated by red star: *P < .05; **P < .01. Intensity levels are not significantly different between preindex and index decedent samples for all eight chemical signals.
