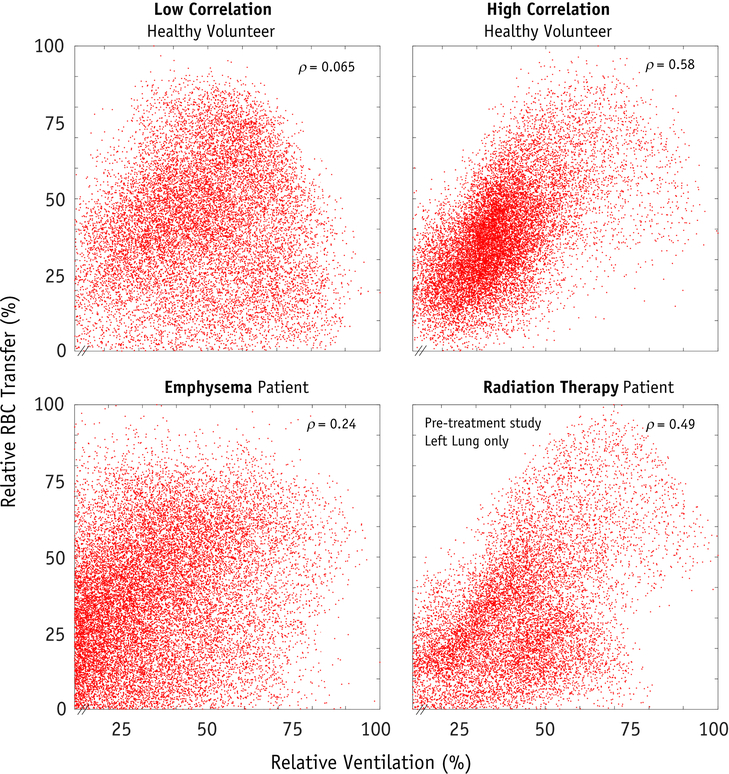
Figure 2.
Four examples of per-voxel scatter plots of relative ventilation versus relative gas transfer, demonstrating the correlation between these two functions. Subject A and B are two example healthy volunteers with low and high correlation coefficients. The emphysema patient and a radiation therapy patient (this time showing the pre-treatment study, left lung only) are shown for comparison. Data is displayed as a percentage of the maximum functioning voxel.

