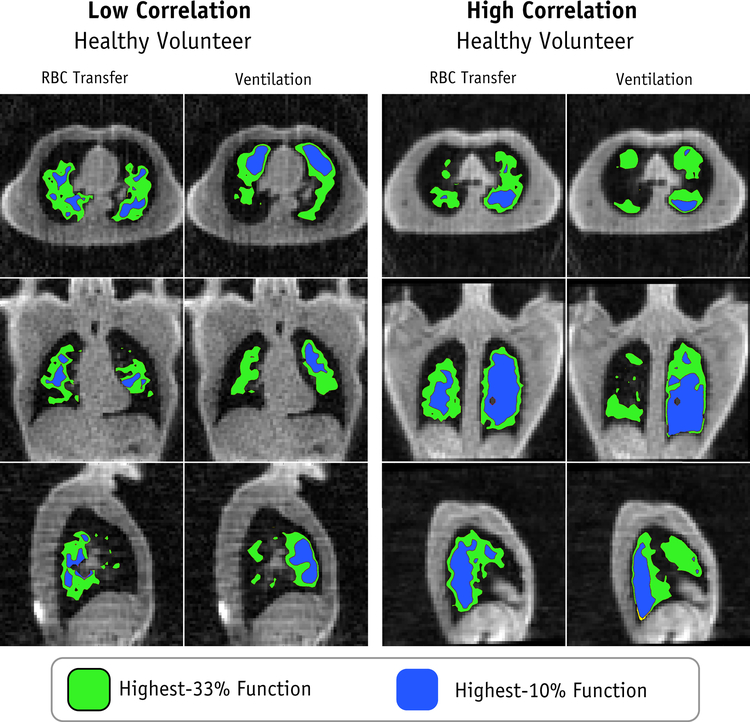
Figure 4.
[A] Correlation of 129Xe in ventilation phase and in Red Blood Cells (RBCs). Pearson correlation coefficient, ρ, for “Both Lungs” and for regional ROIs as described along horizontal axis. Distribution of correlation for healthy volunteer cohort (Npatients=13) shown as boxplots (minimum, 1st quartile, median, 3rd quartile, maximum, and mean = ×) and outliers for “Inferior-50% Lung” and “Central(AP)-33% Lung”. The Radiation Therapy (RT) patients’ results (both pre- and post-RT) and emphysema patient’s results are superimposed on the figure as points, as shown in plot legend. [B] Dice Similarity Coefficients comparing functional planning volume ROIs created separately from ventilation and from RBC gas exchange. We examined four potential planning volumes based on what has been used in the literature for functionally-guided RT planning: Lowest-33%-, Middle-33%-, Highest-33%-, and Highest-10%-function.

