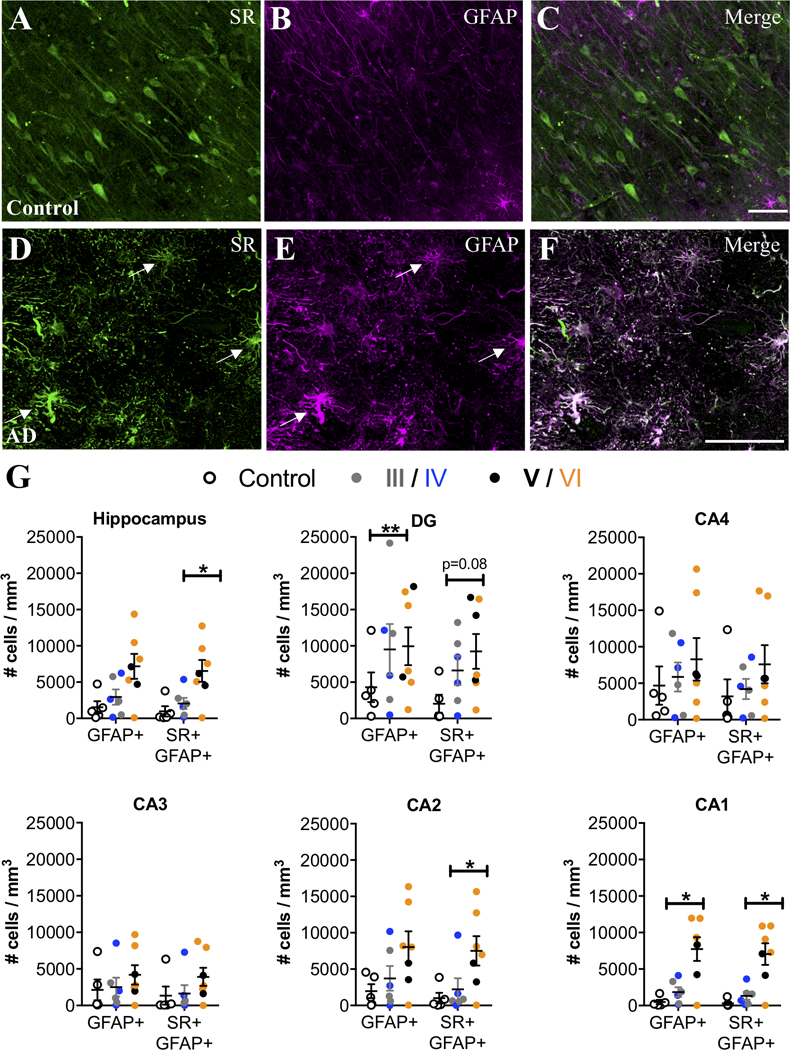
Figure 3. SR is expressed by reactive astrocytes in hippocampus of AD subjects.

Representative images from the anterior hippocampus (pyramidal cell layer/stratum oriens) showing SR (green) and GFAP (magenta) immunostaining of control (A–C) and AD subjects (D–F). White arrows show cells that express both markers (white). The number of GFAP+ and GFAP+/ SR+ cells/mm3 was increased in AD subjects (filled circles; Braak III: gray, IV: blue; V: black, VI: orange) compared to controls (open circles) in the entire hippocampus (GFAP: F2,15=2.54*, P=0.17*; GFAP/SR: F2,15=8.93*, P=0.03*). We also analyzed hippocampal subfields separately: DG (GFAP: F2,15=6.76**, P=0.01**.; GFAP/SR: F2,15=2.94, P=0.08), CA4 (GFAP: F2,15=0.5, P=0.61.; GFAP/SR: F2,15=1.1, P=0.35), CA3 (GFAP: F2,15=0.69, P=0.51; GFAP/SR: F2,15=1.35, P=0.28), CA2 (GFAP: F2,15=1.43*, P=0.28*; GFAP/SR: F2,15=10.79*, P=0.02*), CA1 (GFAP: F2,15=18.69*, P=0.008*; GFAP/SR: F2,15=24.96*, P=0.0007*). * indicates values are adjusted for significant effect of exposure to AD medication. ** indicates values are adjusted for significant effect of ABC burden. Values represent the mean ± SEM.
