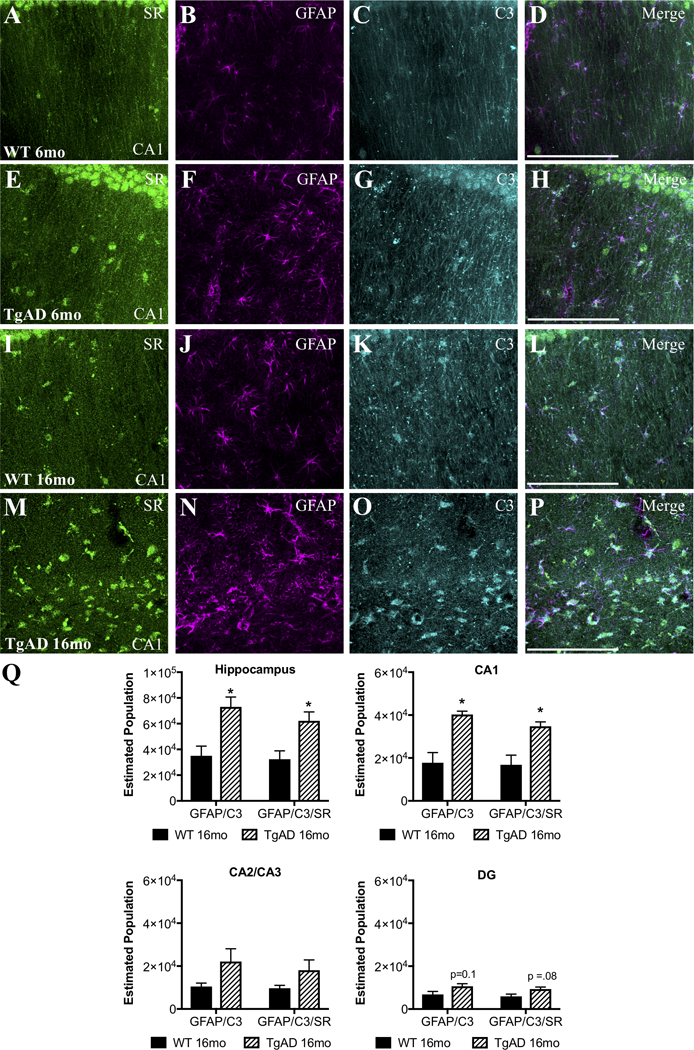
Figure 5. Neurotoxic reactive astrocytes express SR in the hippocampus of TgF344-AD rats.

Representative images from the dorsal hippocampus (CA1 region) of wild-type (WT: 6-months: A–D, 16-months: I–L) and TgF344-AD (6-months: E–H, 16-months: M–P) rats showing SR (green), glial fibrillary associated protein (GFAP; magenta), and C3 (turquoise) immunostaining. Scale bars = 25μm. (Q) The total estimated number of GFAP+/C3+ and GFAP+/C3+/SR+ cells was increased in 16mo TgF344AD subjects (striped bars) compared to controls (black bars) in the entire hippocampus (GFAP/C3: t(4) = 3.5, P = 0.02; GFAP/C3/SR: t(4) = 3.1, P = 0.03). Hippocampal subfields were also analyzed separately: CA1: GFAP/C3: t(4) = 4.5, P = 0.01; GFAP/C3?SR: t(4) = 3.7, P = 0.02; CA2/3: GFAP/C3: t(4) = 1.9, P = 0.13; GFAP/C3/SR: t(4) = 1.7, P = 0.16; DG: GFAP/C3: t(4) = 2.1, P = 0.10; GFAP/C3/SR: t(4) = 2.4, P = 0.08. * indicates significant differences between WT and TgF344AD. Values represent the mean ± SEM.
